Technical analysis can help you forecast the future directional movements of price by studying the historical data records of any asset of interest. Fundamentally, your primary objective is to attain a good understanding of their prior trading patterns in order to recognize and predict similar ones in the future. Even traders, that have a preference to base their strategies on fundamental analysis, also devise confirmation techniques using technical analysis.
Technical analysis is constructed on a number of important theoretical ideas. For example, it involves the study of price movements and its related data without involving the impacts of economic, financial and political events whatsoever. The primary concept is based on the belief that the trading history of an asset has a strong inclination to repeat itself by generating predictable price patterns. Consequently, your key goal is to detect quality trading opportunities by identifying these repeatable patterns.
As currency pairs exhibit a strong bent to progress in trends, their oscillations are not just ad-hoc in nature. For example, if the price of an asset has been advancing in an upwards direction for some extended time, then it will most likely continue to do so until some major catalyst interrupts this process.
If you include technical analysis into your trading strategies then it can assist you in adopting a more business-like and scientific psychology. As such, you will then be better prepared to make more objective and higher quality trading decisions. Essential, you will start to trade in a similar way to experts.
You can use a number of different types of charts to help you perform technical analysis such as:
- You can set your chart to display the very popular candlesticks with each one represented by closing, opening, highest and lowest prices for each time-frame that you have selected, as shown in the following diagram.
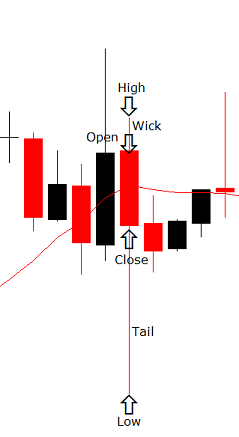
The distance between the opening and highest values of the red bearish candles, presented in the above diagram, is termed the “wick” while the distance between the closing and lowest values is named the “tail”. Candlesticks are extremely useful technical indicators because they have been used in trading for hundreds of years. During this time, many valuable patterns have been identified, such as those displayed in the following diagram:
You will achieve more success with candlesticks if you use them on trading charts utilizing the daily time-frame or higher.
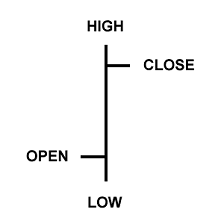
- Alternatively you could activate a bar chart which also shows the closing price, lowest price, opening price and highest price of each time-frame as illustrated in the following diagram.
If you use the power of binary options to trade Forex or even to trade gold from Bullionvault or using a financial derivative, there are many well-proven strategies that you can deploy to identify quality trading opportunities. However, once you have detected a new possible entry point for a trade, then it is wise to search for valid confirmation before proceeding further.
One of the standard techniques deployed to accomplish this task is to analysis candlestick patterns on the trading charts of any asset of interest. Essentially, you should seek confirmation signs that support your new trading opportunity by verifying that it possesses good possibilities of success. However, you must always remain objective when performing such an analysis and not let your emotions interfere with your judgment and carry you away.
For example, you cannot just open new positions simply based on hunches especially if important fundamental events and major technical indicators are suggesting otherwise. If you were to constantly adopt such practices then you will merely suffer serious financial losses in the long-term.
In contrast, you should always analyze trading charts objectively and with care in order to realistically identify those trading opportunities exhibiting maximum profit potential with minimum risk. If none of your trading strategies are producing any such clear-cut signals, then you should consider performing another search but this time using candlestick patterns that have acquired a good reputation for performing this task, e.g. hanging man, etc.
If you are able to identify any, then you should next investigate the fundamental and technical reasons for the creation of the applicable candlestick pattern. You should also revisit the key concepts of your trading strategy in order to detect any backup evidence confirming that the candlestick pattern really is signaling a new quality trading opportunity.