
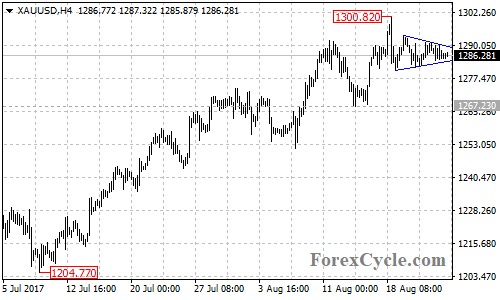
After touching 1.3000 important psychological level, XAUUSD pulled back from 1300.82 and formed a triangle pattern on its 4-hour chart. The triangle pattern is likely consolidation of the uptrend from 1204.77, another rise could be expected after the consolidation.
On the upside
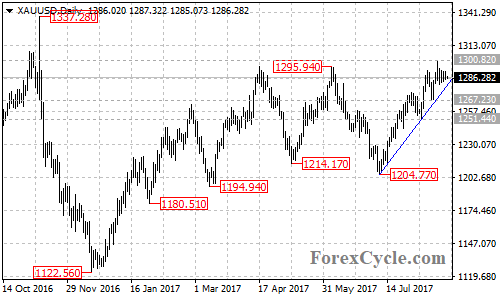
There is a bullish trend line from 1204.77 to 1251.44 with support now at around 1280 on its daily chart. So bullish breakout would more likely be seen.
A clear break above the top trend line of the triangle pattern now at 1289.50 could take price to next resistance level at 1300.82. Above this level will indicate that the bullish movement from 1204.77 has resumed, then next target would be at the November 2016 high of 1337.28, followed by the July 2016 high of 1375.11.
On the downside
A breakout below the bottom support trend line of the triangle pattern now at 1284 could bring price back to test 1267.23 key support. Below this level will confirm that the upside movement from 1204.77 had completed at 1300.82 already, and correction pullback is underway, then the gold price would find next support level at 1251.44, followed by the 61.8% Fibonacci retracement taken from 1204.77 to 1300.82 at around 1241.20.
Technical levels
Support levels: 1284 (the bottom trend line of the triangle pattern), 1280 (the bullish trend line on the daily chart), 1267.23 (the August 15 low), 1251.44 (the August 8 low), 1241.20 (the 61.8% Fibonacci retracement), 1204.77 (the July 10 low).
Resistance levels: 1289.50 (the top trend line of the triangle pattern), 1300.82 (the August 18 high), 1337.28 (the November 2016 high), 1375.11 (the July 2016 high).