
GBPUSD pulled back from the August 3 high of 1.3267 and dropped sharply to 1.2845 area after failing in its attempt to break above 1.3444 resistance.
On the upside
The GBPUSD pair is now facing the support of the major bullish trend line from 1.2109 to 1.2589 on its daily chart. As long as the price is above the trend line, the fall from 1.3267 could be treated as consolidation of the bullish movement from 1.1987 and another rise to retest 1.3444 resistance could be expected after the consolidation.
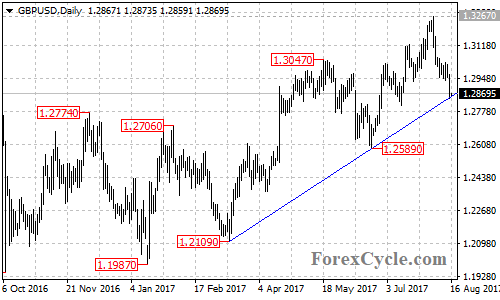
Near term resistance levels are at 1.2930 and 1.3030, above these levels will suggest that the uptrend has resumed, then next target would be at 1.3267 previous high, followed by 1.3444 resistance.
On the downside
A clear break below the bullish trend line on the daily chart could take price to test 1.2589 key support, below this level will confirm that the upside movement from 1.1987 had completed at 1.3267 already, then the following downside movement could bring price back to retest 1.1946 support.
For long term analysis
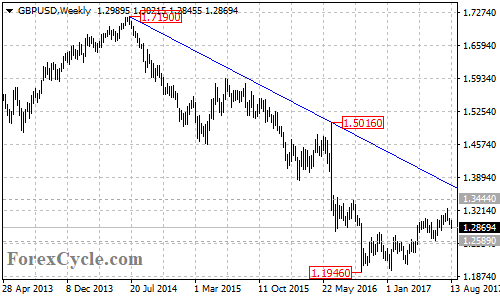
GBPUSD is below the long term bearish trend line from the July 2014 high of 1.7190 to the June 2016 high of 1.5016, now at around 1.3725. As long as the pair is below the trend line, the bounce from the October 2016 low of 1.1946 could be treated as consolidation of the long term downtrend from 1.7190, and a breakdown below 1.1946 support could signal resumption of the downtrend.
Technical levels
Support levels: 1.2845 (the bullish trend line on the daily chart), 1.2589 (the June 21 low, key support), 1.2109 (the March 14 low), 1.1946 (the October 2016 low).
Resistance levels: 1.2930 and 1.3030 (near term support), 1.3267 (the August 3 high), 1.3444 (the September 2016 high), 1.3725 (the trend line on the weekly chart).