ForexCycle.com
  • Home
  • Forex Analysis
    • Long Term Forex Analysis
    • Short Term Forex Analysis
    • Special Focus
    • Daily Forex Reports
    • Forex Signals
  • Forex Articles
    • Market Cycle
    • Indicator
    • Elliott Wave
    • Fibonacci Sequence
    • Forex Market
    • Forex Trading
    • Technical Analysis
    • Chart Pattern
  • Trading Strategy
  • Forex Brokers
    • Avatrade
    • Broker News
    • Broker Review
  • Elliott Wave Courses
    • Markets Reverse
    • 5 Ways Using Trendlines
    • Overview of MACD
    • Relative Strength Index
    • Japanese Candlesticks
    • Moving Averages
    • Fibonacci Ratios
    • Two-Bar Pattern
    • Market Myths Exposed
  • Contact Us

GBPUSD Daily Analysis – August 16, 2017

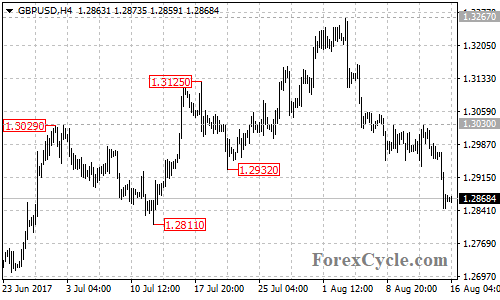
GBPUSD extended its bearish movement from 1.3267 to as low as 1.2845, facing the bullish support trend line on the daily chart. A clear break below the trend line support could take price to next support level at around 1.2600. Resistance levels are at 1.2930 and 1.3030, as long as these levels hold, the downtrend will continue.

GBPUSD 4-hour chart

Author ForexCycle.comPosted on August 16, 2017Categories Short Term Forex AnalysisTags GBPUSD

Post navigation

Previous Previous post: EURUSD Daily Analysis – August 16, 2017
Next Next post: AUDUSD Daily Analysis – August 16, 2017

Resources

  • Unlock Your Trading Potential with EA Builder
  • Elliott Wave Principle

Recent Posts

  • Microsoft Corp. $MSFT Blue Box Area Offers A Buying Opportunity
  • Gartner Inc. (IT) Elliott Wave Analysis: Wave IV Correction Targets Key Support Zone
  • OPEN Stock: Real Value Emerging or Just a Retail Trap?
  • UPST Favors ((2)) Pullback – Bullish Structure Remains Intact
  • IONQ Stock Analysis: Resuming the Uptrend After a Brief Correction
  • Robinhood (NASDAQ: HOOD) Enters Wave (III) Final Stage
  • Platinum (PL) Price Soars in Strong Uptrend
  • TXN Elliott Wave View: Dip Approaches Blue Box Buying Zone
  • CRWD in Final Stage: One More High Could Trigger Market Correction
  • Elliott Wave Analysis: USDJPY Zigzag Correction Likely to Fail Below 149
  • Facebook
  • Instagram
  • Twitter
  • LinkedIn
  • Telegram
  • Home
  • Forex Analysis
  • Forex Articles
  • Contact Us
  • Forex Blog
  • Disclaimer
  • Forex Resources
  • Archives
  • RSS
Copyright © 2005 - 2025 ForexCycle.com. All rights reserved.