
XAUUSD broke above the triangle patter on its 4-hour chart last Friday and continued its short term bullish movement from the May 9 low of 1214.17, and the price extended to as high as 1269.37. Near term support is at around 1255, as long as this level holds, the bullish move could be expected to continue over the next several days.
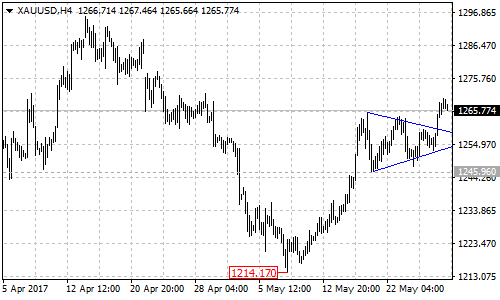
The resistance of the short term uptrend
There are two important resistance levels for the short term uptrend from 1214.17.
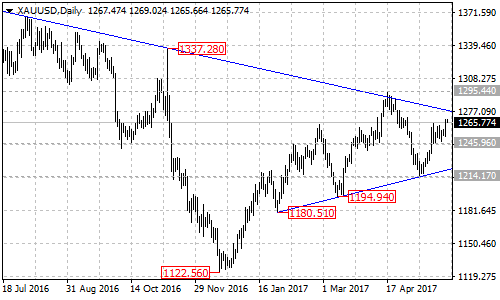
1. The bearish trend line resistance from the July 2016 high of 1375.11 to the November 2016 high of 1337.28 on the daily chart, now at around 1278.
2. The April 17 high of 1295.44 resistance.
The key support for the short term uptrend
The key support for the short term uptrend is at 1245.96. Only a breakdown below this level will indicate that the uptrend is complete. This will trigger another fall to test the support of the ascending trend line from January 27 low of 118.51 to the March 10 low of 1194.94 on its daily chart, now at around 1221.50.
Long term
For the long term analysis. The gold price stays above the bullish trend line on the daily chart, indicating that the price remains in uptrend from the December 2016 low of 1122.56. only a clear break below the trend line support could signal completion of the uptrend.
Technical levels
Support levels: 1255 (near term support), 1245.96 (the key support of the short term uptrend), 1221.50 (the ascending trend line on the daily chart).
Resistance levels: 1278 (the bearish trend line on daily chart), 1295.44 (April 17 high).