
The USDCAD pair has recently witnessed significant market movements, pivoting between notable resistance and support levels, influencing the overall market trend.
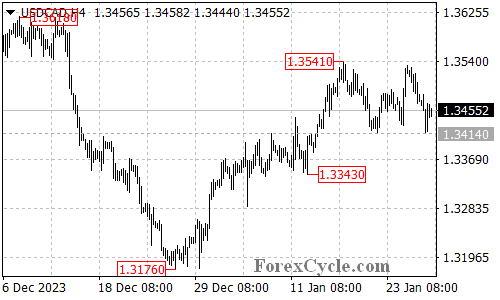
Recent Failed Breakout Attempt
USDCAD endeavored to breakout of the 1.3541 resistance level but ended up drawing back into the trading range between 1.3414 and 1.3541.
Current Support Level and Potential Implications
Now, the pair is facing the support level situated at 1.3414. If the price happens to breakdown below this point, it would imply that the initial upside movement that started from 1.3176 ended upon reaching the 1.3541 price point.
Possible Support Levels After Breakdown
If such a breakdown does occur, the pair would likely seek the next level of support at 1.3343, potentially declining further to reach the 1.3300 mark.
Maintaining Support and Possible Uptrend Consolidation
Should the 1.3414 support level hold, it’s possible that the price action occurring within the trading range could be understood as consolidation for an ongoing uptrend. This uptrend stems from the 1.3176 price point, and a potential breakout above the 1.3541 resistance could initiate a further upside movement, potentially extending towards the 1.3618 resistance level.
Overall, the USDCAD market is showcasing a delicate balance between key resistance and support levels with potential for significant opportunities for traders based on price action and trend direction.