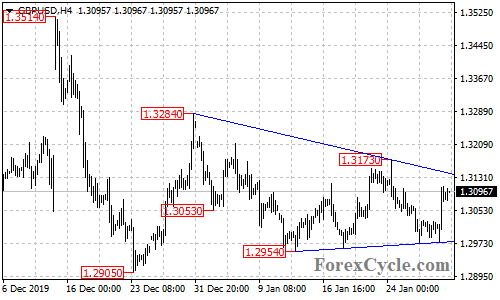
GBPUSD formed a triangle pattern on the 4-hour chart. A break of the upper border of the pattern could take the price to next resistance level at 1.3280, followed by 1.3400. On the downside, a breakdown below the lower border of the pattern would indicate that the downtrend from 1.3514 has resumed, then further decline towards 1.2750 could be seen.