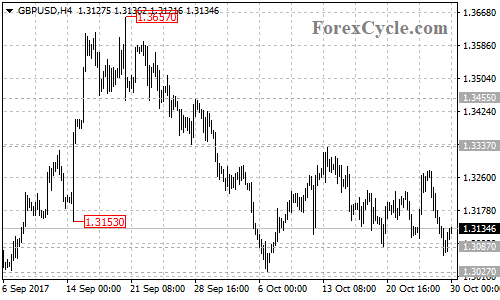
GBPUSD broke below 1.3087 support, indicating that the downside movement from 1.3337 has resumed. Further decline towards the major support trend line on the daily chart could be expected, a clear break below the trend line support will suggest that the whole upside movement from 1.1946 (Oct 2016 low) is complete, then further decline towards 1.2774 (Aug 24 low) could be seen. Near term resistance is at 1.3165, only break above this level could trigger another rise towards 1.3337.