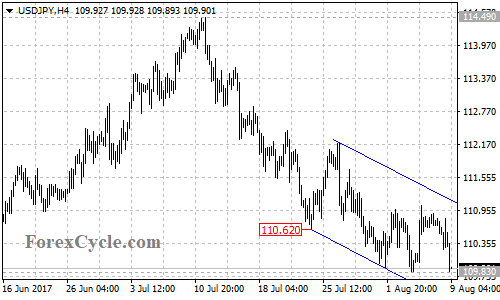
USDJPY failed to break out of the top trend line of the price channel on the 4-hour chart and is now facing 109.83 support. A breakdown below this level will indicate that the downtrend from 114.49 has resumed, then the following downside movement could bring price into 109.00 zone. Only a clear break above the channel resistance could signal completion of the downtrend.