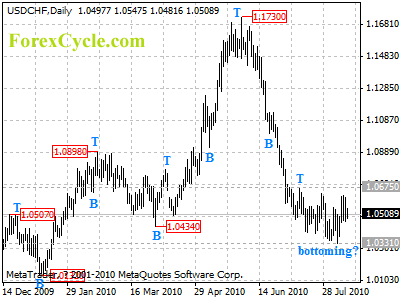
USDCHF is forming a cycle bottom at 1.0331 level on daily chart. Range trading between 1.0331 and 1.0675 is expected in a couple of weeks. Key resistance is at 1.0675, above this level could indicate that the downward movement from 1.1730 had completed at 1.0331 already, then the following uptrend could bring price to 1.1200-1.1300 area.
For long term analysis, USDCHF formed a cycle top at 1.1730 level on weekly chart. Further fall to 1.0200 to reach next cycle bottom on weekly chart is expected in a couple of weeks.