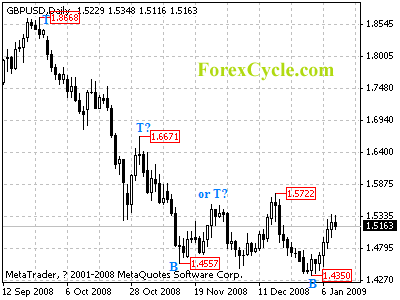
GBPUSD rebounds from 1.4350. Further rise is still possible to test 1.5722 previous high resistance. A break above this level will indicate that the downtrend from 2.0158 (July 15, 2008 high) has completed, and then consolidation in a range between 1.4350 and 1.6671 could be seen to follow.
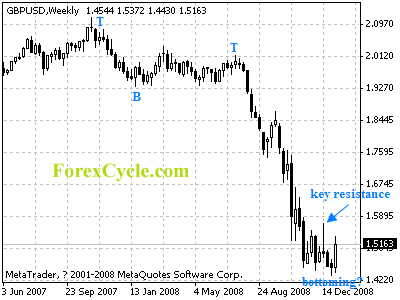
For long term analysis, GBPUSD might be forming a long term cycle bottom at 1.4350 on weekly chart. Key resistance is located at 1.5722, a break above this level will confirm the cycle bottom.


