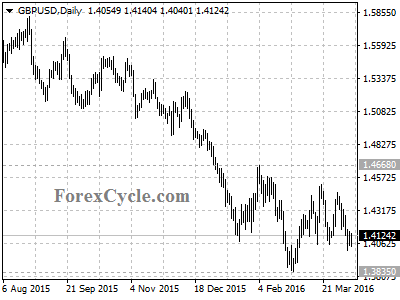
GBPUSD moved sideways in a range between 1.3835 and 1.4668 for several weeks. As long as 1.4668 key resistance holds, the price action in the range could be treated as consolidation of the downtrend from 1.5929 (Jun 18, 2015 high), and another fall towards 1.3000 is still possible after consolidation. On the upside, a break of 1.4668 resistance will indicate that the downtrend had completed at 1.3835 already, then the following upward movement could bring price to 1.6500 area.