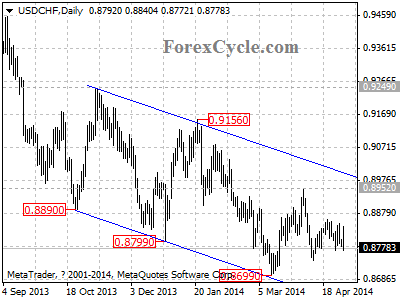
USDCHF moved sideways in a range between 0.8699 and 0.8952. Key resistance is located at the upper line of the price channel on daily chart, as long as the channel resistance holds, the price action in the range could be treated as consolidation of the downtrend from 0.9751 (Jul 9, 2013 high), another fall to 0.8300 area is still possible after consolidation. Only a clear break above the channel resistance could signal completion of the downtrend.