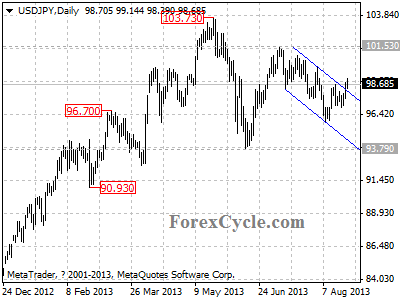
USDJPY broke above the upper line of the price channel on daily chart, suggesting that the fall from 101.53 had completed. Further rise to test 103.73 resistance would likely be seen over the next several weeks, as long as this level holds, the price action from 103.73 could be treated as consolidation of the long term uptrend from 75.57 (Oct 31, 2011 low), sideways movement in a range between 93.79 and 103.73 could be expected to continue.