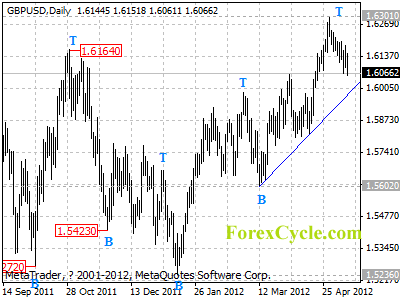
GBPUSD has formed a cycle top at 1.6301 on daily chart. Further decline to test the support of the upward trend line could be seen next week, a clear break below the trend line could signal completion of the uptrend from 1.5602, then the following downward movement could bring price back to 1.5000 area.
For long term analysis, GBPUSD is in correction of the downtrend from 1.6745 (Apr 28, 2011 high). Another fall towards 1.4500 could be expected after correction.


