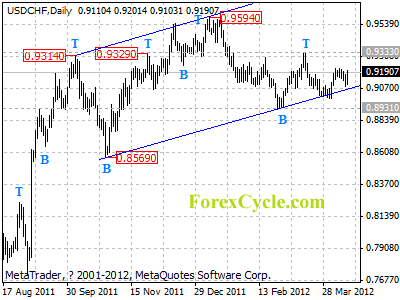
USDCHF formed a sideways consolidation in a range between 0.8931 and 0.9333. Another rise to test 0.9333 resistance would likely be seen next week, a break above this level will signal resumption of the uptrend from 0.7067. Support remains at the lower line of the price channel on daily chart, only a clear break below the channel support could trigger another fall towards 0.8569.
For long term analysis, USDCHF may be forming a cycle bottom at 0.8931 on weekly chart. Further rise towards 1.0000 could be seen over next several months.


