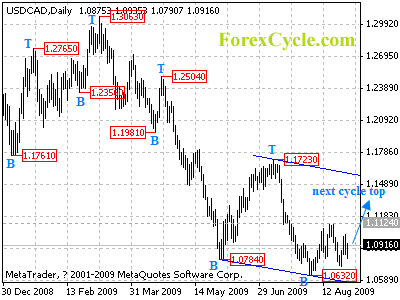
USDCAD traded in a range between 1.0632 and 1.1124 for several weeks. Move towards the upper border of the price channel on daily chart to reach next cycle top on daily chart would more likely be seen, and a break above 1.1124 will confirm such case. However, below 1.0632 will indicate that the downtrend from 1.1723 has resumed, then further fall to 1.0200 zone is expected to follow.
For long term analysis, USDCAD breaks below 1.0784, suggesting the long term downtrend from 1.3063 has resumed. Deeper decline is now in favor, and next target would be at 1.0000 zone.

