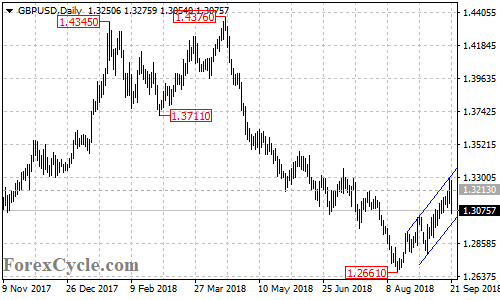
GBPUSD broke above 1.3213 resistance, suggesting that the downside movement from 1.4376 had completed at 1.2661 already. Further rally would likely be seen in a couple of weeks and next target would be at 1.3500 area. Near term support is located at the bottom of the price channel on the daily chart, a breakdown below the channel support could bring the price back towards 1.2661 previous low.