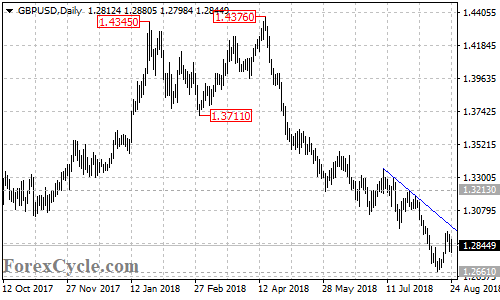
GBPUSD stays below a falling trend line on the daily chart and remains in the downtrend from 1.4376. As long as the trend line resistance holds, the bounce from 1.2661 could be treated as consolidation for the downtrend and another fall towards 1.2300 is still possible after the consolidation. On the upside a clear break of the trend line resistance could bring the price back to test 1.3213 key resistance, only a break of this level could signal completion of the downtrend.