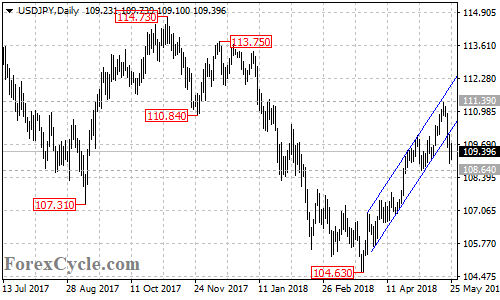
USDJPY broke below the bottom of the price channel on its daily chart, suggesting that the upside movement from 104.63 had completed at 111.39 already. Further decline would likely be seen and a breakdown below 108.64 support could take the price to 106.00 area. Resistance is now at 111.39, only break above this level could trigger another rise towards 115.50.