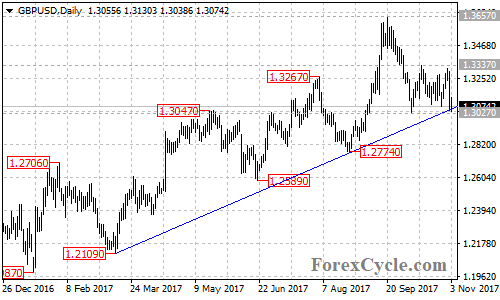
GBPUSD is facing the support of the rising trend line on the daily chart. A clear break below the trend line support could take price to next support level at 1.2774. Below this level will confirm that the bullish movement from 1.1946 (Oct 2016 low) had completed at 1.3657 already, then the following downside movement could take price towards 1.1946 previous low. However, as long as the trend line support holds, the pullback from 1.3657 would possibly be consolidation of the uptrend, and one more rise towards 1.4000 is still possible after the consolidation. Near term resistance is at 1.3337, above this level could signal resumption of the uptrend.