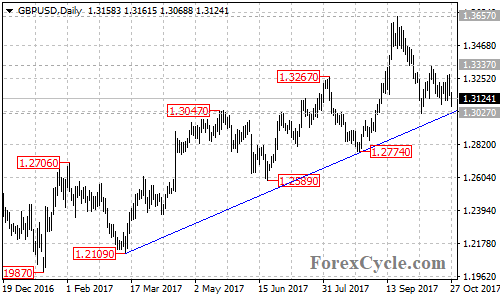
GBPUSD is now facing the bullish support trend line from 1.2109 to 1.2774 on the daily chart. A clear break below the trend line support could take price to a key support level at 1.2774, below this level will confirm that the upside movement from 1.1946 (Oct 2016 low) had completed at 1.3657 already, then further decline towards 1.1946 previous low could be seen. On the upside, as long as the price is above the trend line, the fall from 1.3657 would possibly be consolidation of the uptrend, and a breakout of 1.3337 resistance could trigger another rise towards the bearish trend line on its weekly chart.