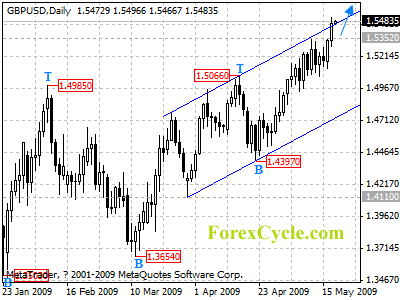
GBPUSD is testing the resistance of the upper border of the price channel on daily chart, a clear break above the channel resistance will signal a sharp move towards 1.6000-1.6500 area. Near term support is at 1.5060 followed by 1.4940, as long as these levels hold, we’d expect the uptrend from 1.4397 to continue.
For long term analysis, GBPUSD is in consolidation of the long term downtrend from 2.1161 (2007 high). Rebound to 1.6500-1.7000 area to reach the next cycle top on weekly chart is expected.