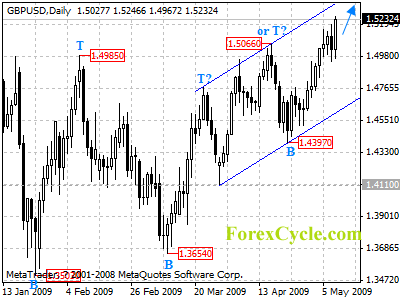
GBPUSD broke above 1.5066 previous high and reached as high as 1.5247 level. Further rise to test the upper border of the rising price channel on daily chart is expected next week, a clear break above the channel resistance will signal a sharp move towards 1.6000 or even higher. Near term support is at the lower border of the price channel now at 1.4600, as long as this level holds, the uptrend from 1.3654 will continue.
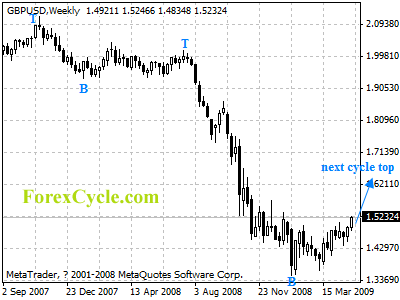
For long term analysis, GBPUSD is in consolidation of the long term downtrend from 2.1161 (2007 high). Rebound to 1.6000-1.6500 area to reach the next cycle top on weekly chart is expected.