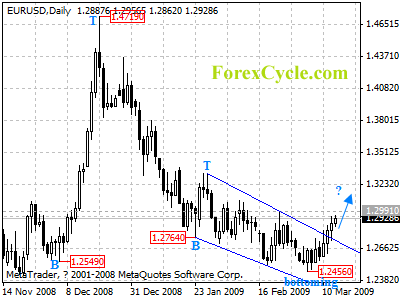
EURUSD broke above the resistance of the falling wedge pattern, suggesting that a cycle bottom is being formed at 1.2456 on daily chart, key resistance is located at 1.2991, a break above this level will confirm the cycle bottom and indicate that the fall from 1.4719 has completed, and then further rally could then be seen to 1.3150-1.3200 area.
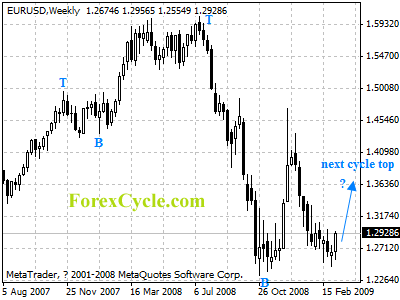
For long term analysis, EURUSD is in range trading between 1.2329 and 1.4719. rebound to 1.4000 zone to reach the next cycle top on weekly chart would more likely be seen before breaking below 1.2329 previous low.


