
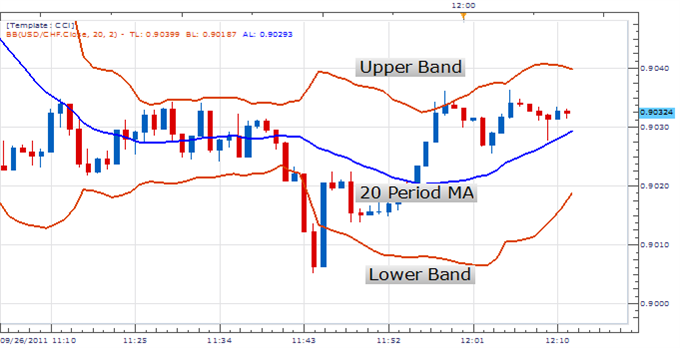
Bollinger Bands are a versatile technical analysis indicator widely used among traders. John Bollinger first developed this indicator as a solution to find relative highs and lows in dynamic markets. The indicator itself is comprised of an Upper, Lower and Middle line. The middle line is comprised of a 20 period moving average. While the Upper and Lower Band boundaries are 2 standard deviations from the MA.
As price oscillates between the indicators upper and lower extremes Bollinger Bands become an excellent tool to gauge volatility. When bands contract there is less volatility in the market, which is a great indication to use a range bound strategy. Likewise, Bollinger Bands will expand as the market becomes more volatile. At these times traders may employ a breakout or a trending based strategy.
One popular method for using Bollinger Bands includes using an indicator such as MACD to time entry’s. During a range bound environment, look to buy a currency pair from the lower Bollinger Band using MACD crossovers. Likewise a trader will look to sell a currency off the top Bollinger band when the MACD line crosses below its signal line. A variety of exits can be used, including closing orders on a touch of the opposing band.
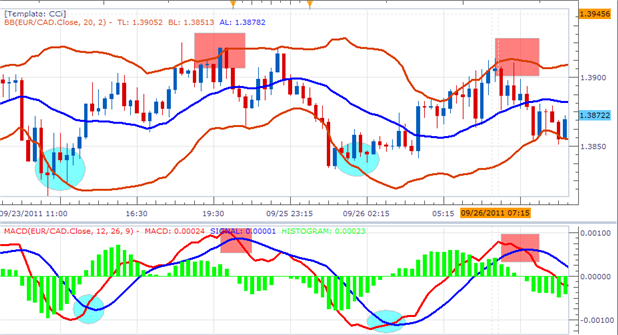
The above opportunity shows a setup to trade the EUR/CAD pair in a ranging environment. Bollinger Bands may again be used for levels of support and resistance, with our entry being based off of the MACD indicator. Bollinger Bands may also be used in a trending environment, with entry’s being placed when price touches the upper band in a down trend or the lower band in a downtrend.
Written by Dailyfx.com
![]()