

Hello fellow traders ,
As our members know, we have identified many trading setups recently, including the XLV ETF trading setup.
Our Elliott Wave analysis identified a clear three-wave correction from the recent peak. The price then reached the Equal Legs area, highlighted as our Blue Box buying zone.
This is exactly the type of setup we closely monitor within our trading service. The Blue Box provides a clearly defined area where we look for a potential entry, while the Elliott Wave structure helps us manage risk and identify the next potential targets.
In the following sections, we will break down the XLV trading setup in detail and explain how the opportunity developed.
XLV Elliott Wave 1-Hour Chart – 08.28.2026
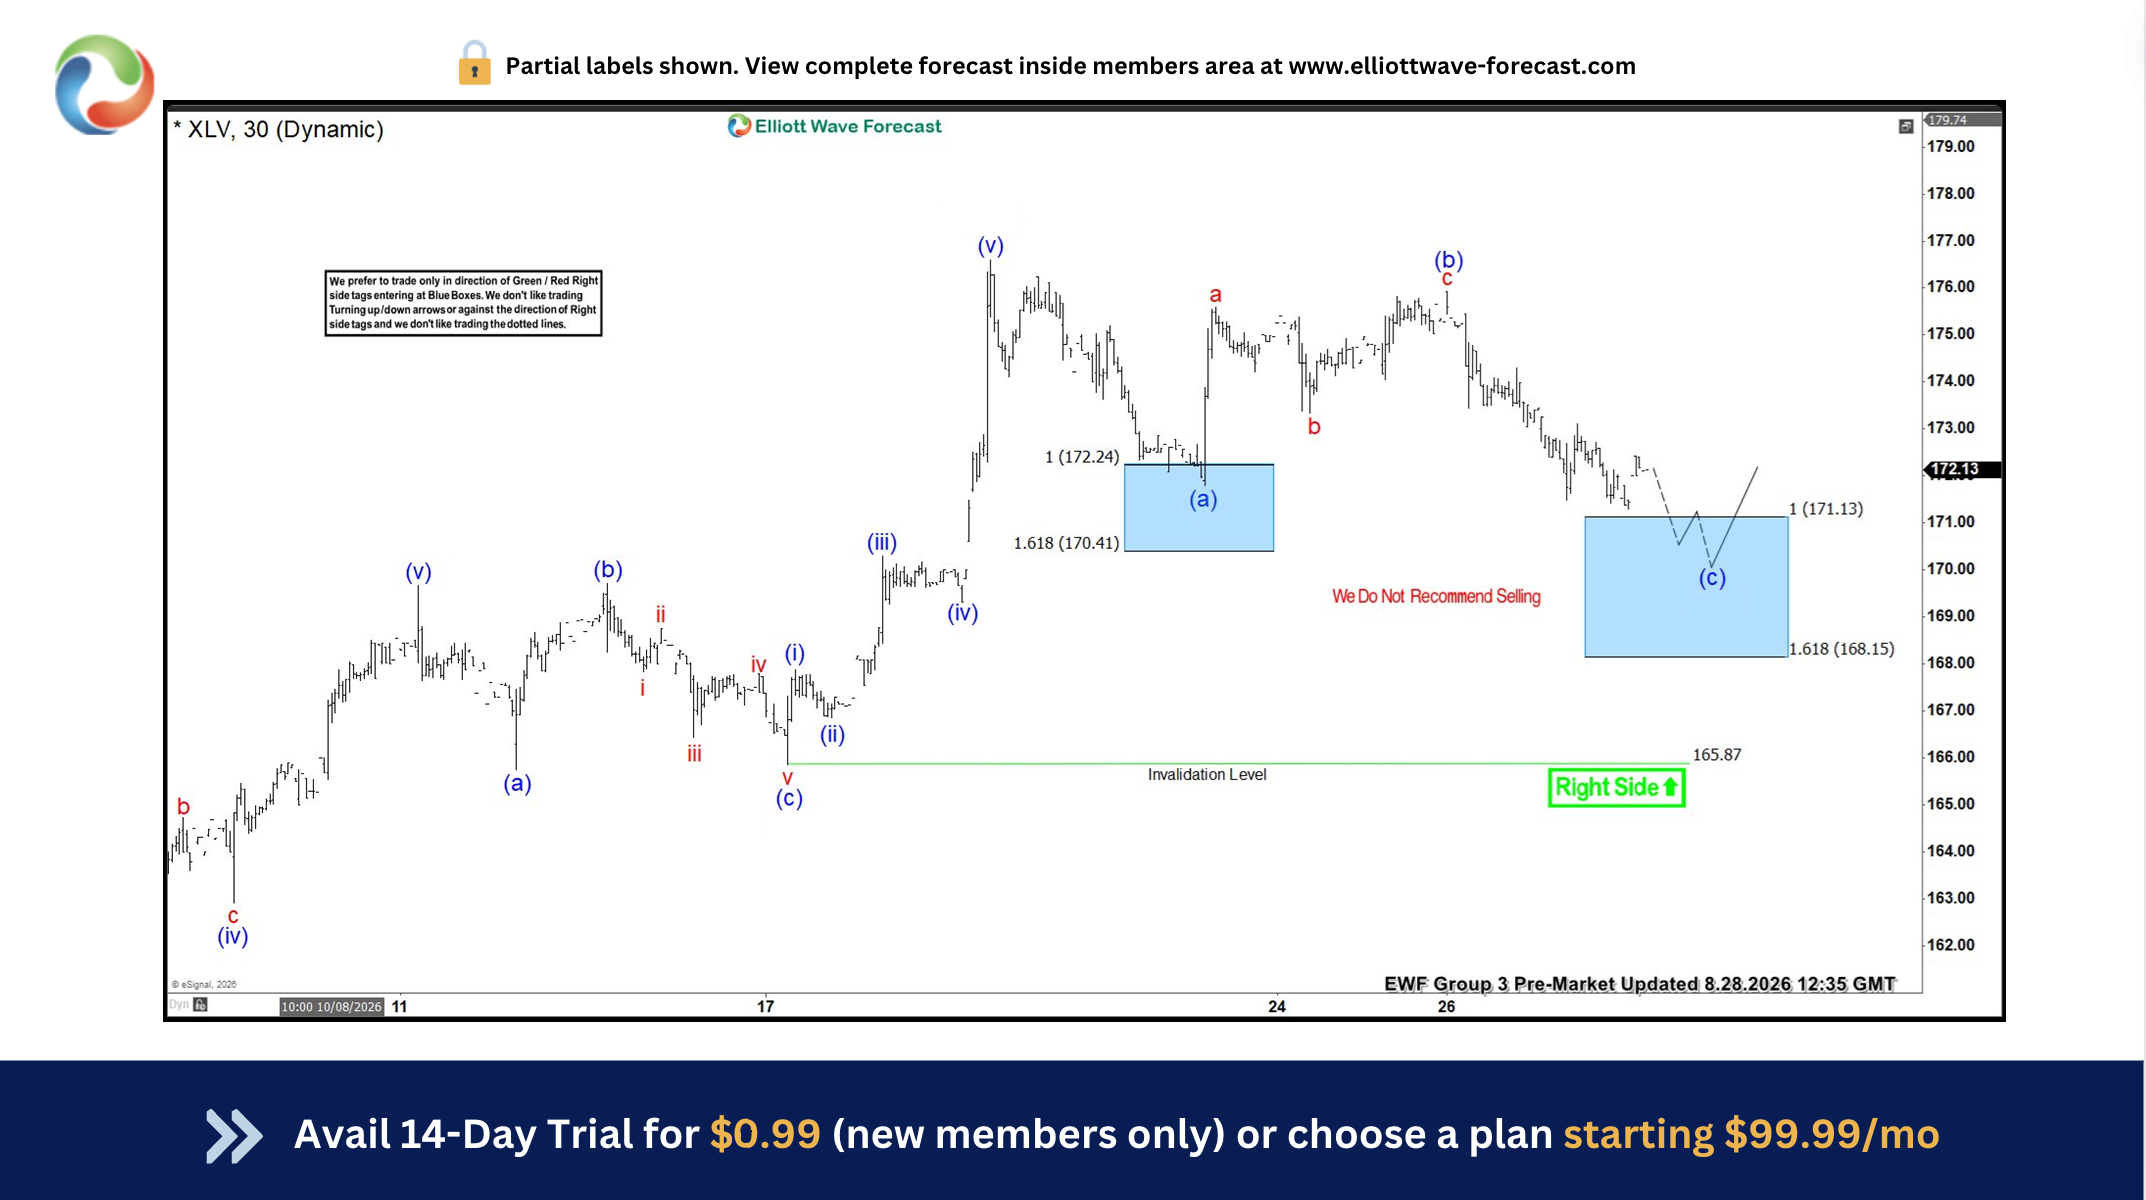
The Health Care Select Sector SPDR Fund (XLV) is showing a clear three-wave pullback from the recent high. The correction is developing as a potential Zig Zag (a)-(b)-(c) pattern, bringing price closer to our Blue Box buying zone at 171.13–168.15. This is the key area we are watching for the next opportunity.
At this stage, we do not favor selling XLV. Instead, our focus remains on the long side. As the main trend is still bullish, we expect buyers to have a chance to step in from the Blue Box area. From there, XLV could produce at least a three-wave bounce, with the potential to continue higher and eventually reach new highs.
More importantly, the setup comes with a clear trading plan. If the expected bounce reaches the 50% Fibonacci retracement against the red B-wave high, we can move the stop loss to breakeven and secure partial profits. A break below the 1.618 Fibonacci Extension at 168.15 would invalidate the setup.
This is the type of opportunity we look for every day for our members: a clearly defined entry zone, a specific invalidation level, and a plan for managing the trade once the market starts moving in our favor.
Instead of chasing price or guessing where to enter, our members can follow these setups as they develop in real time.
The official trading strategy for identifying 3, 7, and 11 swings and Equal Legs setups is explained in detail in our educational video. The video is available exclusively to members inside the membership area.
How to Read Our Charts
- Red bearish stamp + Blue Box = Selling setup
- Green bullish stamp + Blue Box = Buying setup
- Black stamp = No trade zone
XLV Elliott Wave 1-Hour Chart 09.02.2026
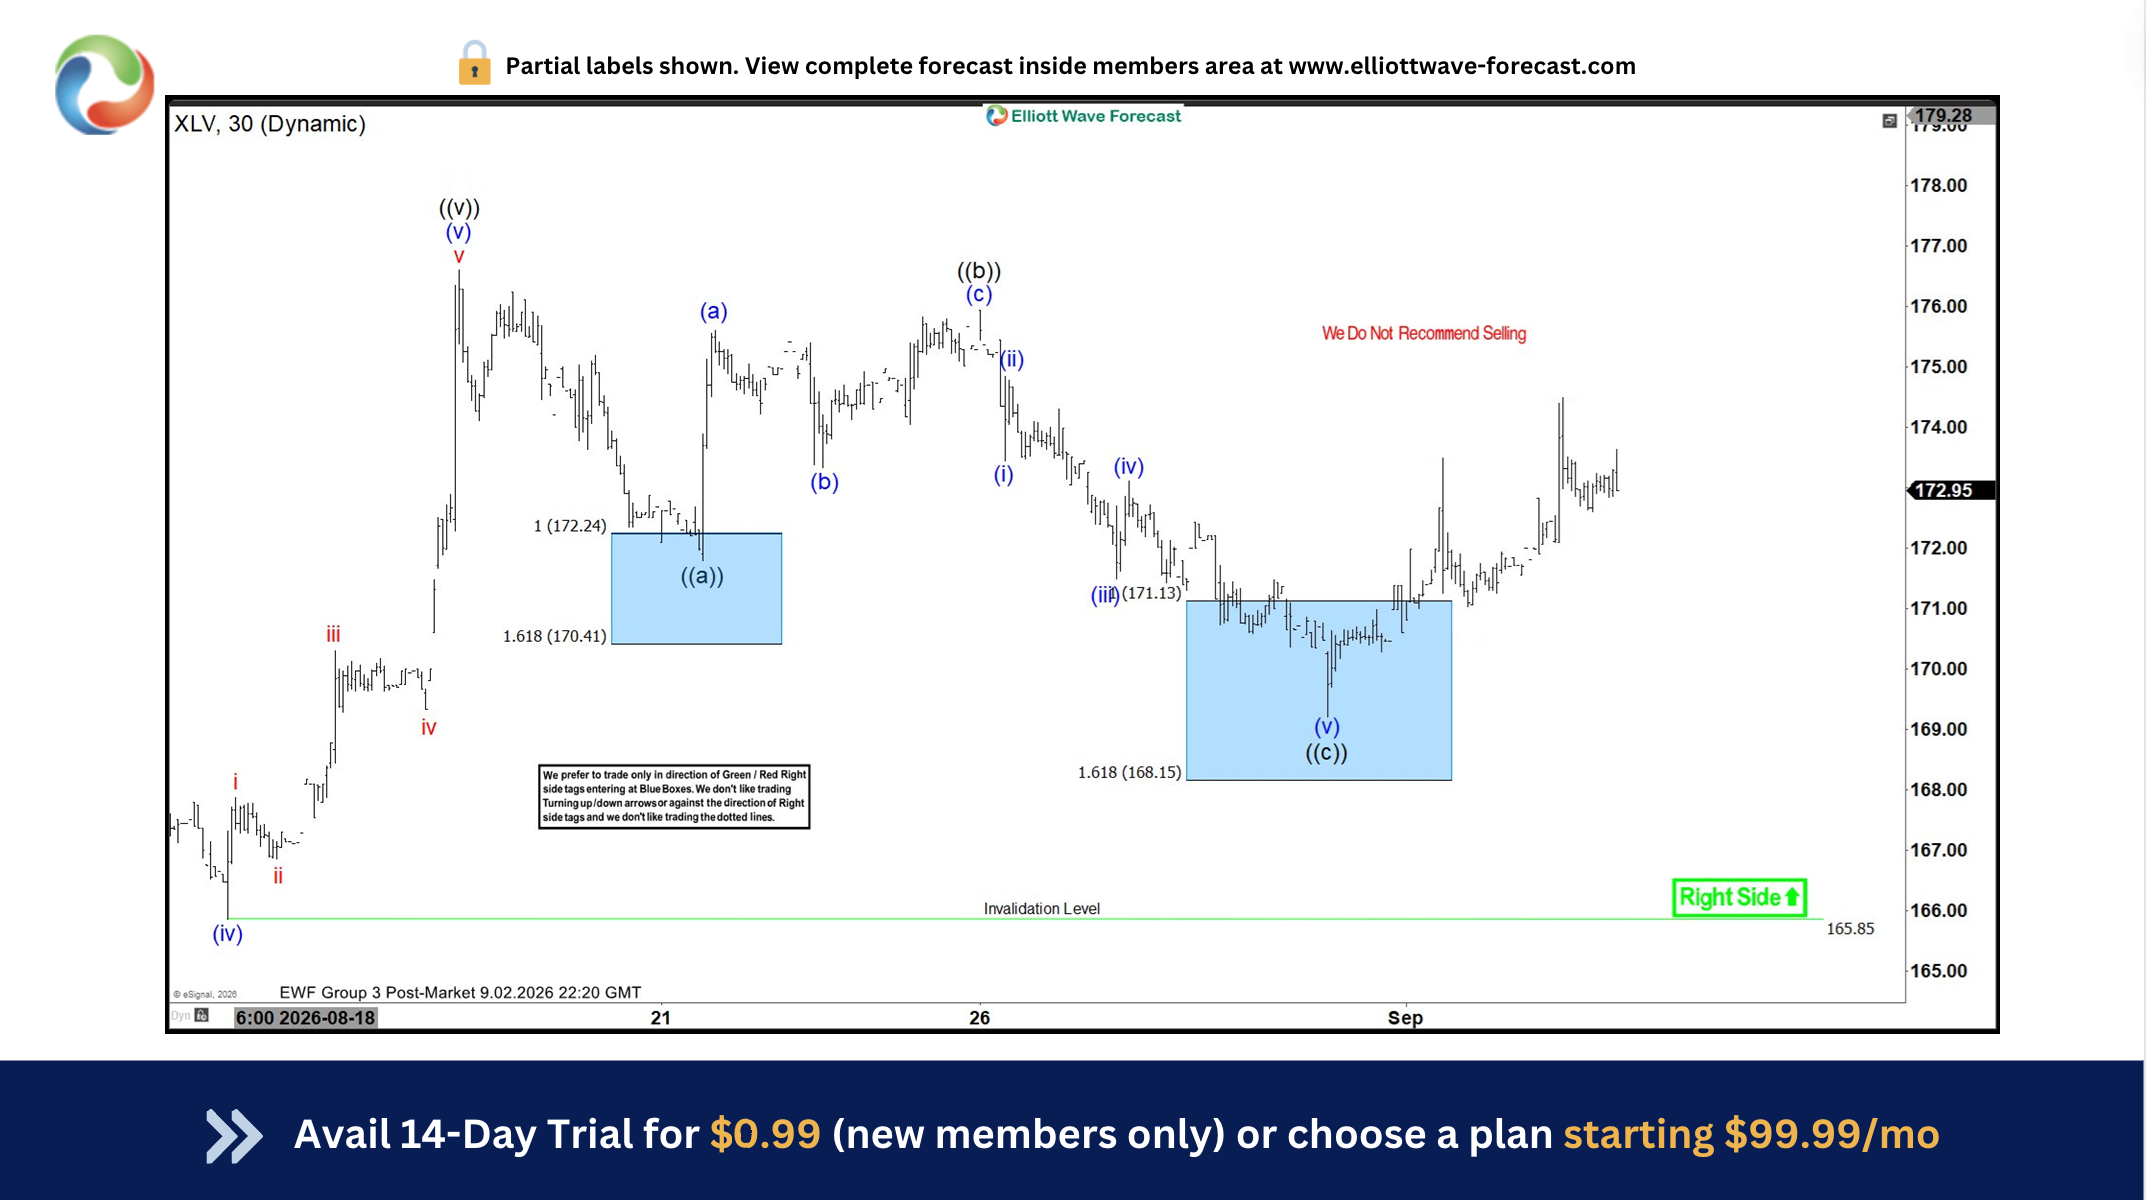
The ETF found buyers as expected. As a result, long positions taken from this zone can now be considered risk-free, with the stop moved to breakeven. Our next target is for XLV to break to new highs. This would confirm that the next bullish leg is underway.
However, if the latest low breaks, XLV could enter a deeper correction. In that case, we would look for the pullback to create a new trading opportunity.
You can find the latest XLV charts, trading setups, and target levels inside our membership area.
The best instruments to trade are those with incomplete bullish or bearish swings. These setups are highlighted in our Sequence Report, while the highest-conviction opportunities are presented in the Live Trading Room.
Keep in mind that the market is dynamic, and the outlook may have changed in the meantime. Our member Chat Rooms are open 24 hours a day, Monday through Friday, on trading days, providing ongoing expert guidance on market trends and Elliott Wave analysis. Members can ask questions about market structure and technical setups at any time during trading days.
Source: https://elliottwave-forecast.com/etfs/xlv-elliott-wave-another-trading-setup-presented-to-members/