

PM is correcting against the long-term bullish cycle. Amid the pullback, a support zone emerges, where buyers could find fresh interests for new bids.
Philip Morris International Inc. (PM) is a leading global tobacco and nicotine company headquartered in Stamford, Connecticut. It manufactures and markets well-known cigarette brands, including Marlboro, and is actively transitioning toward smoke-free products through its “Beyond Nicotine” strategy. PMI’s flagship smoke-free product, IQOS, uses heat-not-burn technology and has gained significant global adoption. Operating in over 180 markets, the company focuses on reducing the health impact of smoking by investing heavily in science-based alternatives and next-generation nicotine delivery systems.
PM is bullish. The stock got listed in March 2008 when it traded at $46.9. A year after the launch, price plummeted to $32. However, it has not looked back since the $32 all-time low. It has emerged into a huge bullish trend. The stock completed the first cycle in June 2017 when it peaked at $123. We identified the end of this cycle as wave (I) – supercycle degree. Wave (I) completed a clear impulse wave structure. From that high, wave (II) emerged and completed a zigzag structure in March 2020 at $56. From the March 2020 low, wave (III) emerged. From that low, a clear 5-wave structure is close to completion as the weekly charts below show.
PM Weekly Elliott Wave Analysis – 1st Scenario
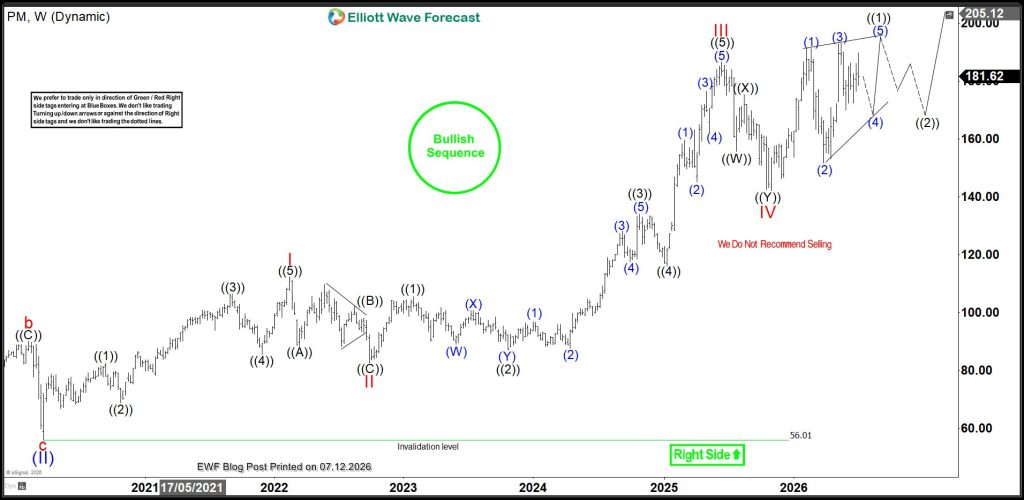
The weekly chart above shows the sub-waves of wave (III) from the low of March 2020. Price has completed waves I, II, III and IV of (III) and now in V of (III) from the low of March 2025. Meanwhile, the structure from the low of March 2025 appears choppy and looks like an emerging ending diagonal structure. This proposed ending diagonal structure could either finish wave ((1)) of V of (III) or wave V of (III) as the second scenario below shows.
PM Weekly Elliott Wave Analysis – 2nd Scenario
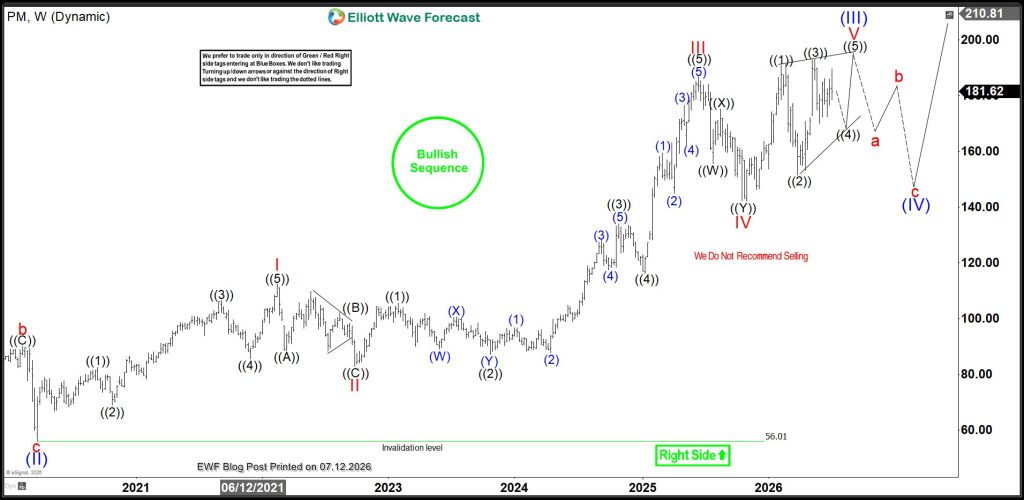
The second scenario above shows the imminent completion of wave (III). It’s important to note that a major pullback is imminent if a diagonal structure completes as proposed. The pullback could be wave ((2)) of V of (III) correcting the bullish cycle from November 2025. On the other hand, it could be a much deeper pullback correcting wave (III) from the March 2020 low. Thus, in either case, investors and traders will focus on buying the next pullback in either of the scenario.
PM Trade Setup – Can we Trade wave ((4))/(4)?
In October 29, 2025 we had a setup to go long from the extreme of wave (IV). We used the chart below in that blog post. You can read details HERE

With the chart above we identified 144.10-124.79 as the blue box zone where price could finish wave IV. Price found support at the zone as expected and rallied by over 33%. Our blog readers who took that trade from the blue box would have reached targets. Meanwhile, a similar setup for wave ((4))/(4) could be emerging. Thus, readers should take note of the blue box in the chart below.
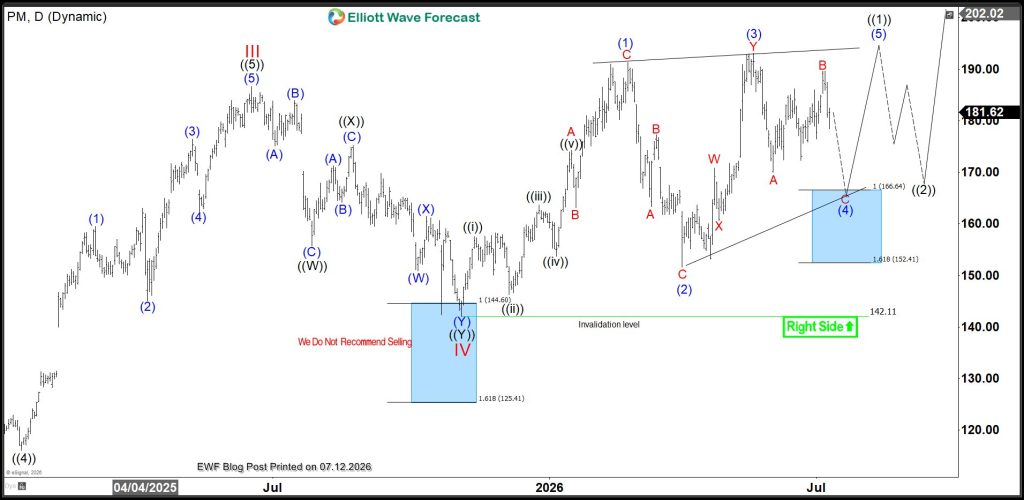
The current pullback from May 2026 high is emerging as a simple zigzag structure. It’s either wave (4) or ((4)) in the first or second scenario respectively. However, the count differences don’t matter very much in this case. Both scenarios show the same path and structure and have the same blue box at 166.64-152.41. Traders should go long from the blue box. Interesting.. Right?