

In this technical blog, we will look at the past performance of the Daily Elliott Wave Charts of $XME. In which, the rally from July 2022 low ended in an impulse sequence & showed higher high sequence in weekly structure therefore, called for an extension higher to take place. We knew that the structure in XME should remain supported & extend higher. So, we advised members not to sell the ETF & buy the dips in 3, 7, or 11 swings at the blue box areas. We will explain the structure & forecast below:
XME Daily Elliott Wave Chart From 3.22.2026
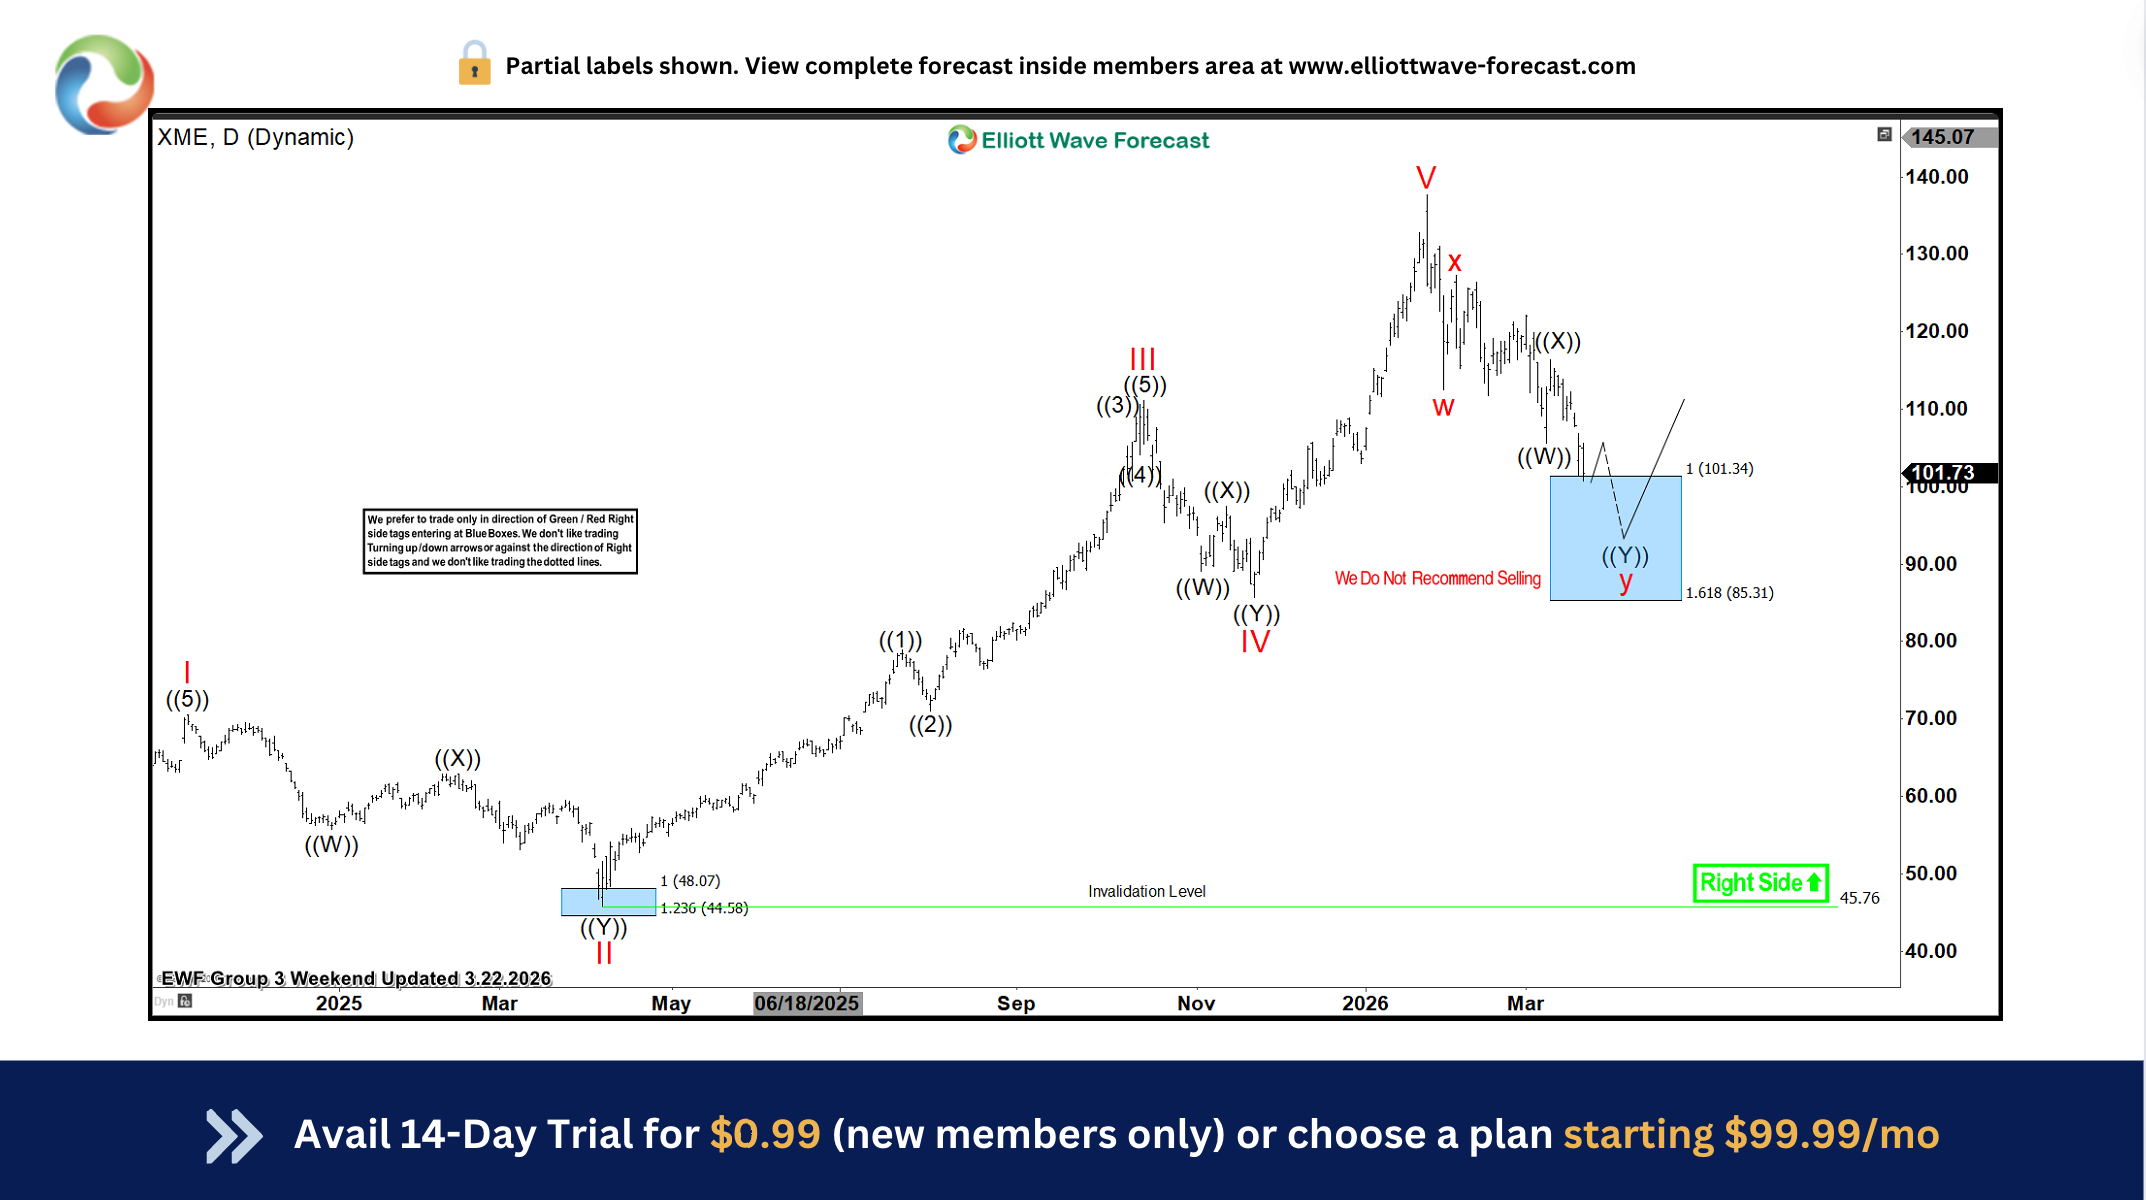
Here’s the Daily Elliott wave Chart from the 3.22.2026 Weekend update. In which, the rally to $135.68 high completed the cycle from July 2022 low & made a pullback against that cycle. The internals of that pullback unfolded as Elliott wave double three correction where wave w ended at $117.14 low. A rally to $126.45 high-ended wave x bounce. Then started the next leg lower in wave y towards $101.34- $85.31 blue box area. From there, buyers were expected to appear looking for new highs ideally or for a 3-wave bounce minimum.
XME Latest Daily Elliott Wave Chart From 5.24.2026
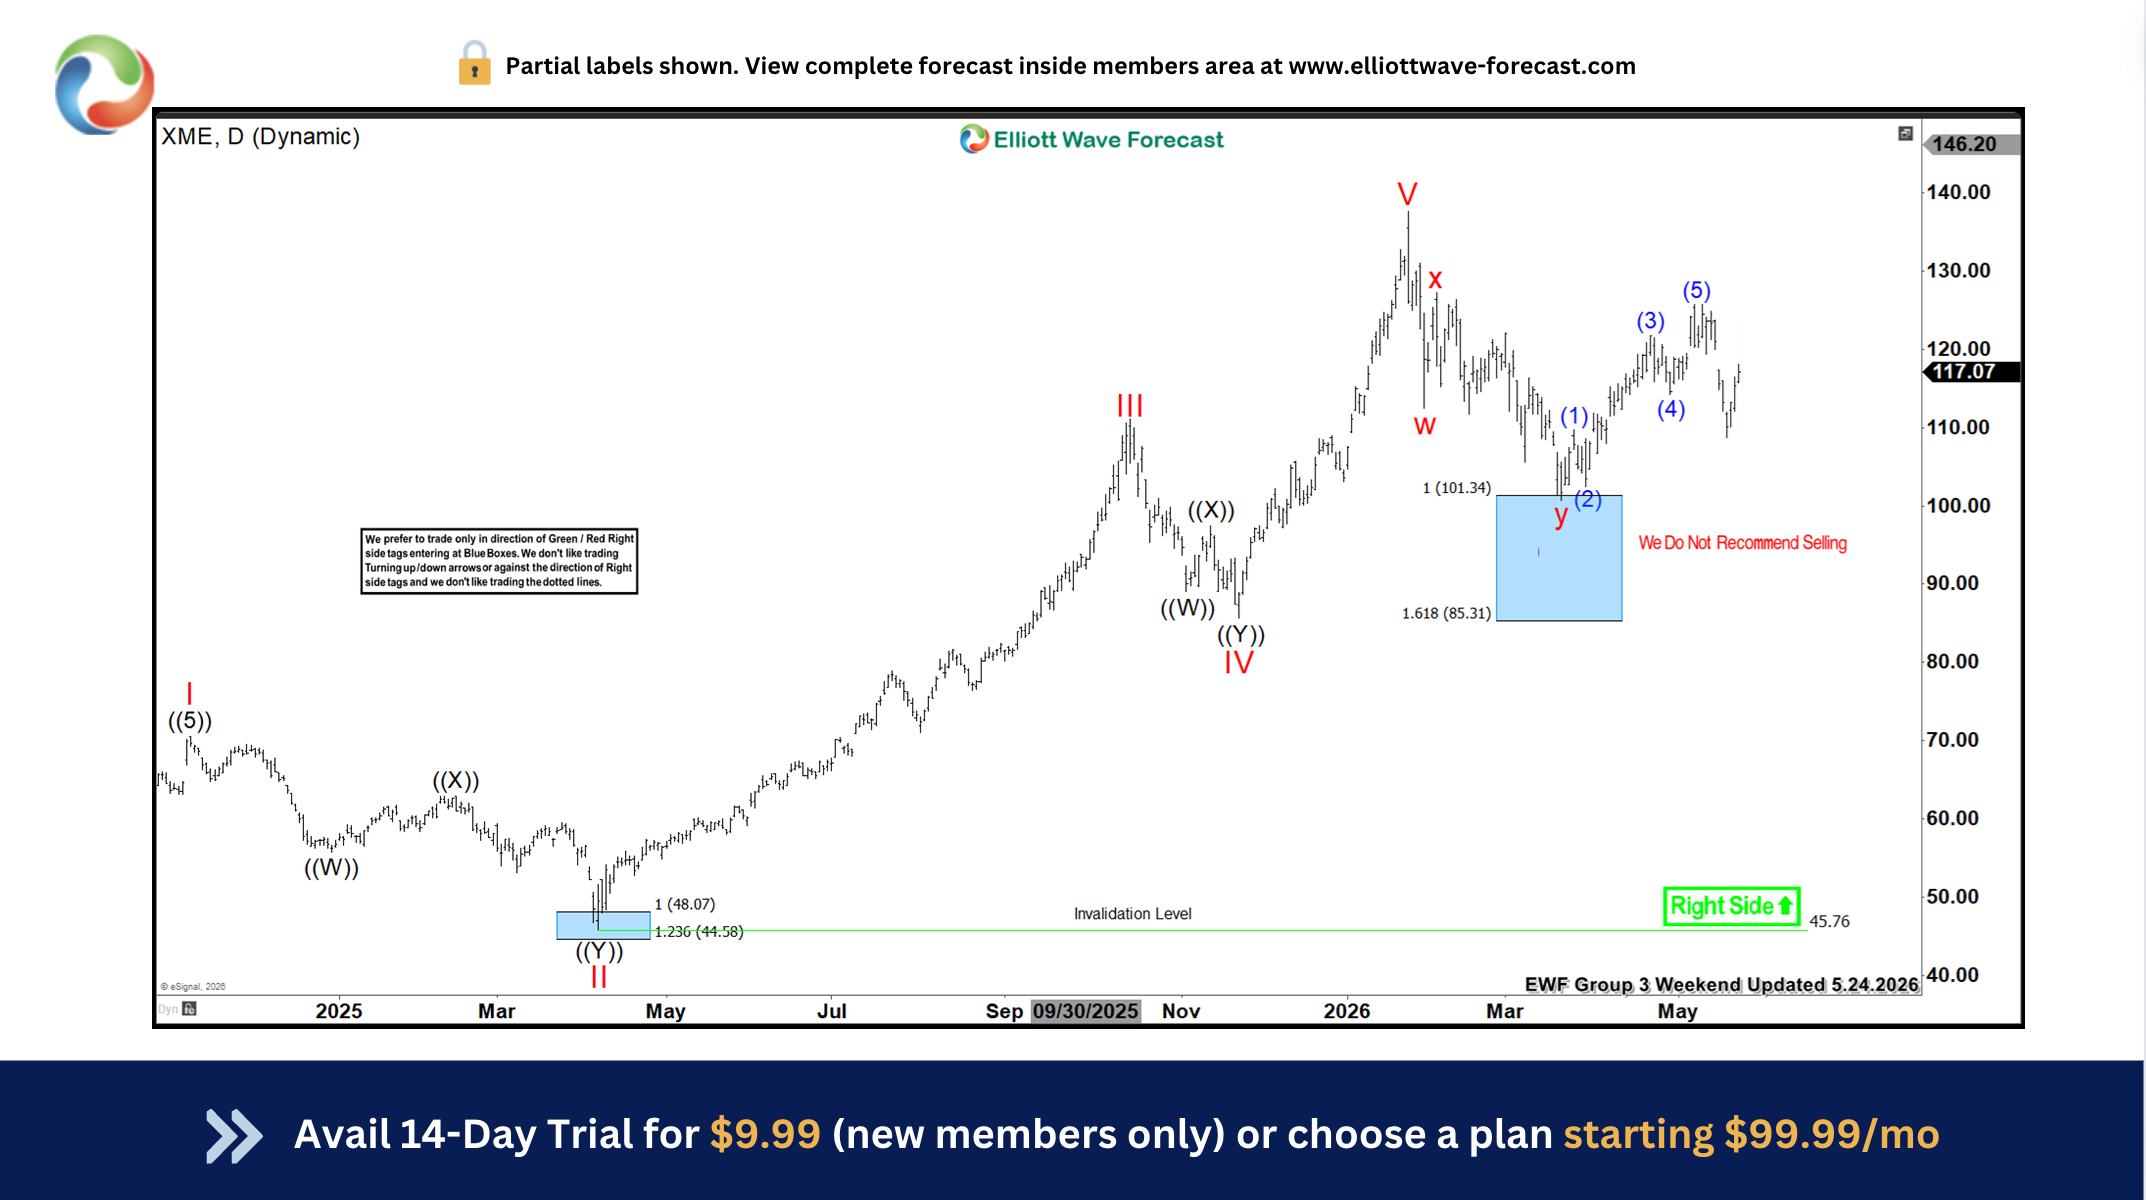
This is the latest Daily Elliott wave Chart from 5.24.2026 Weekend update. In which the XME is showing a very strong reaction higher taking place, right after ending the double correction within the blue box area. Allowed members to create a risk-free position shortly after taking the long position at the blue box area. However, a break above $135.68 high is needed to confirm the next leg higher targeting $146.57- $160.75 area minimum.