
Analysts expect AT&T (T) to deliver stable performance in the second quarter of 2026. First, the company continues to show solid execution in wireless and fiber growth. Moreover, recent earnings have consistently beaten expectations, which strengthens investor confidence. In addition, Wall Street recently raised price targets, reflecting improving sentiment and operational momentum. As a result, analysts maintain a moderate buy outlook, with targets near the 30 level.
From a fundamental perspective, analysts focus on fiber expansion and 5G integration as key growth drivers. Furthermore, AT&T expects low-single-digit revenue growth and steady EBITDA expansion through 2026. At the same time, the company guides EPS between 2.25 and 2.35, supported by cost savings and capital returns. However, revenue growth remains modest, which limits upside in the short term. Therefore, from a technical view, analysts expect consolidation below resistance, while maintaining a bullish bias if support holds.
Elliott Wave Outlook: AT&T (T) Weekly Chart Noviembre 2025
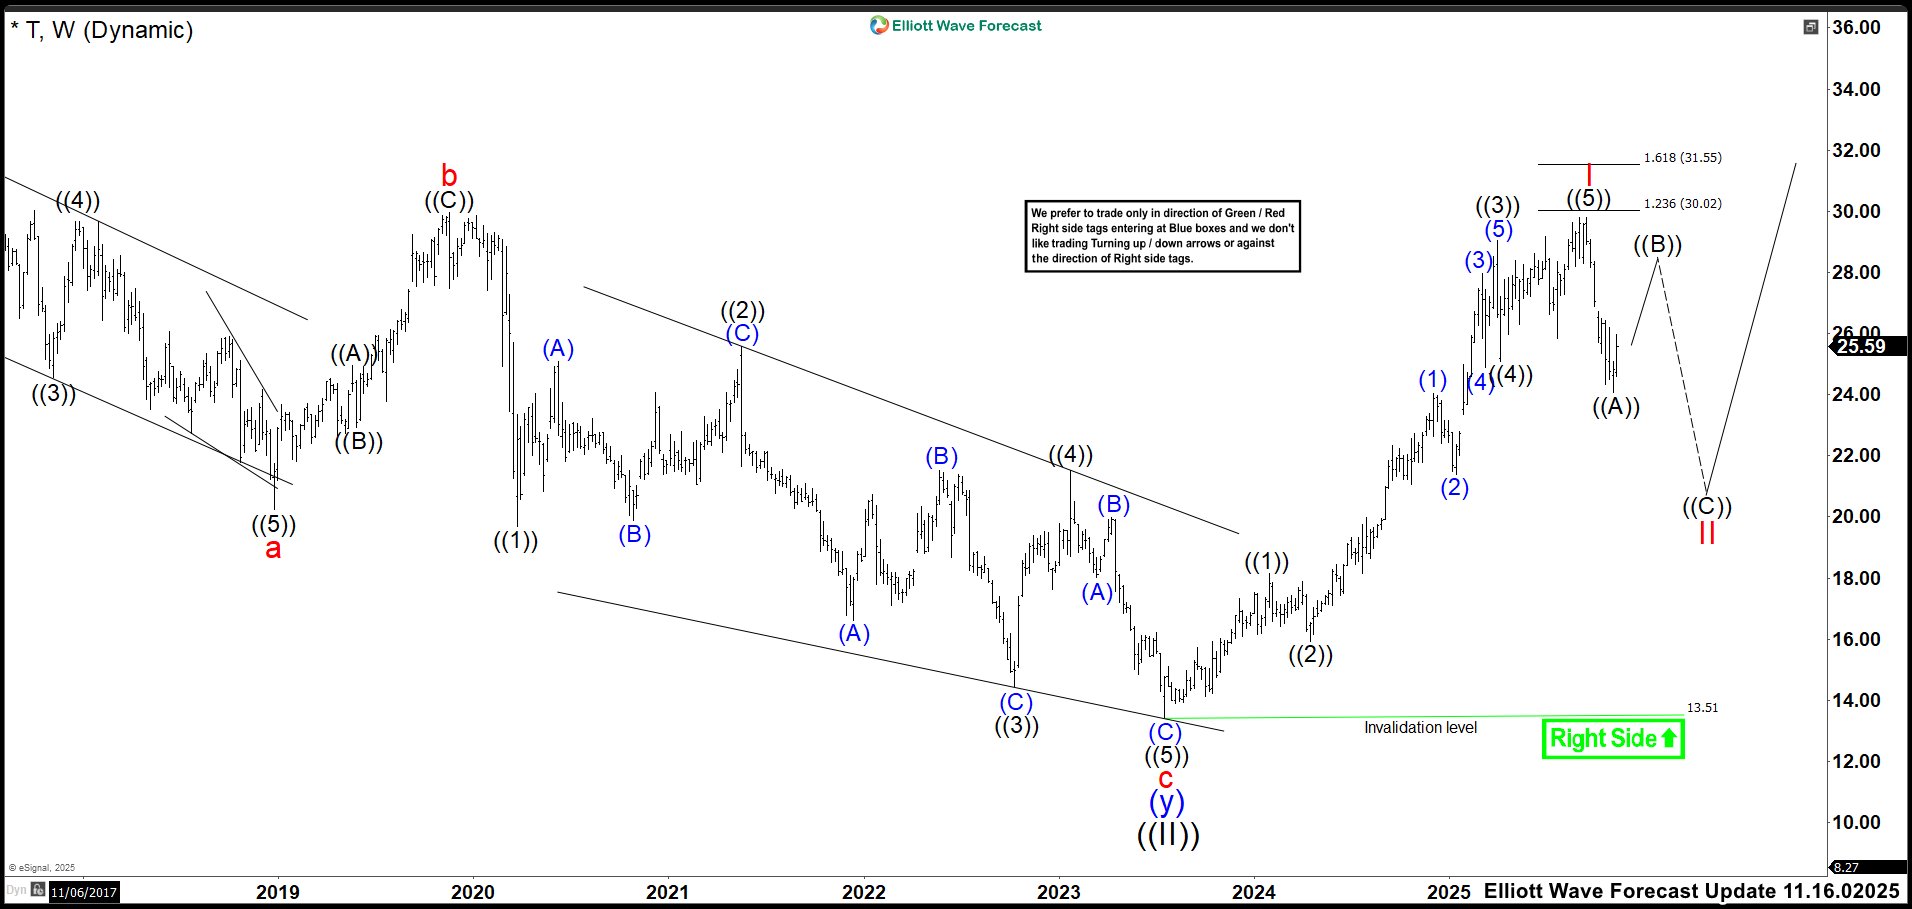
On September 15, 2025, T completed an impulse that began in 2023, reaching 29.79 per share. The price missed the ideal target zone by just a few cents. Wave ((5)) formed an ending diagonal, which finalized impulse wave I and triggered a reversal.
From that peak, the market declined into the expected 24 area. However, this drop represented only wave ((A)) of corrective wave II.
We expected a rebound in wave ((B)), with the recovery remaining capped below 29.79. Afterward, the market was expected to decline again in wave ((C)) of II. The ideal zone for the pullback to end was between 23.54 and 19.70. Within that range, we could look for new buying opportunities targeting a break above the wave I high of 29.79. (If you want to learn more about Elliott Wave Principle, please follow these links: Elliott Wave Education and Elliott Wave Theory.)
Elliott Wave Principle Behind the Market Structure
Impulse
An impulse is a clean 5‑wave pattern that drives the trend forward.
- Waves 1‑3‑5 are strong and directional.
- No overlap between waves 1 and 4.
- Wave 3 is usually the strongest.
- Structure is clear, with increasing momentum.
Elliott Wave Outlook: AT&T (T) Weekly Chart March 2026
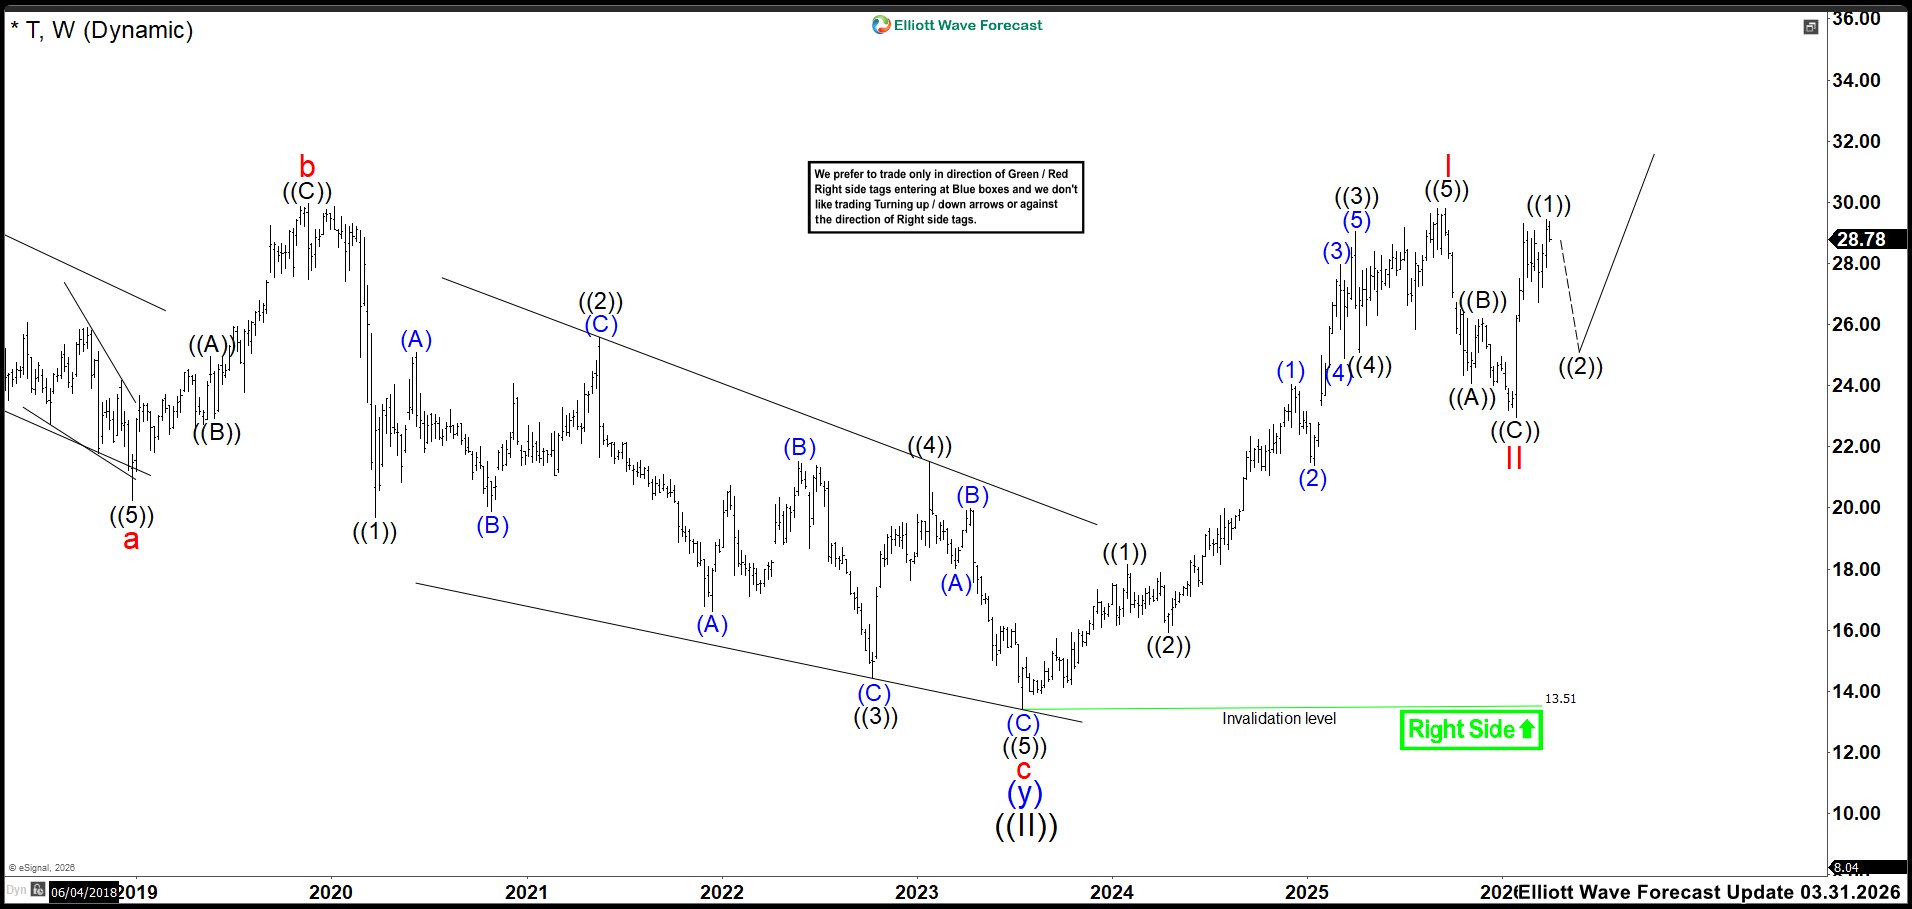
In this new update of T, we see that wave ((B)) produced a relatively short rebound to 26.20. Then, the market continued lower in wave ((C)), ending within the target zone at 22.95.
From that point, price has delivered a strong rally. However, it has not yet broken the 29.79 high. Therefore, we still cannot rule out a flat correction. This scenario means the market could revisit the 22.00 area before continuing higher.
At this stage, we label the high at 29.43 as wave ((1)). Next, we expect a pullback into the 26.96–25.43 zone. This area should act as support before the rally resumes. We also expect a reaction within this zone. However, if price breaks it easily, the market could extend lower toward the 22.00 area. After that, the rally could restart.