
Hello everyone! In today’s article, we’ll examine the recent performance of Apple Inc. ($AAPL) through the lens of Elliott Wave Theory. We’ll review how the rally from the August 01, 2025 low unfolded as a 5-wave impulse followed by a 3-swing correction (ABC) and discuss our forecast for the next move. Let’s dive into the structure and expectations for this stock.
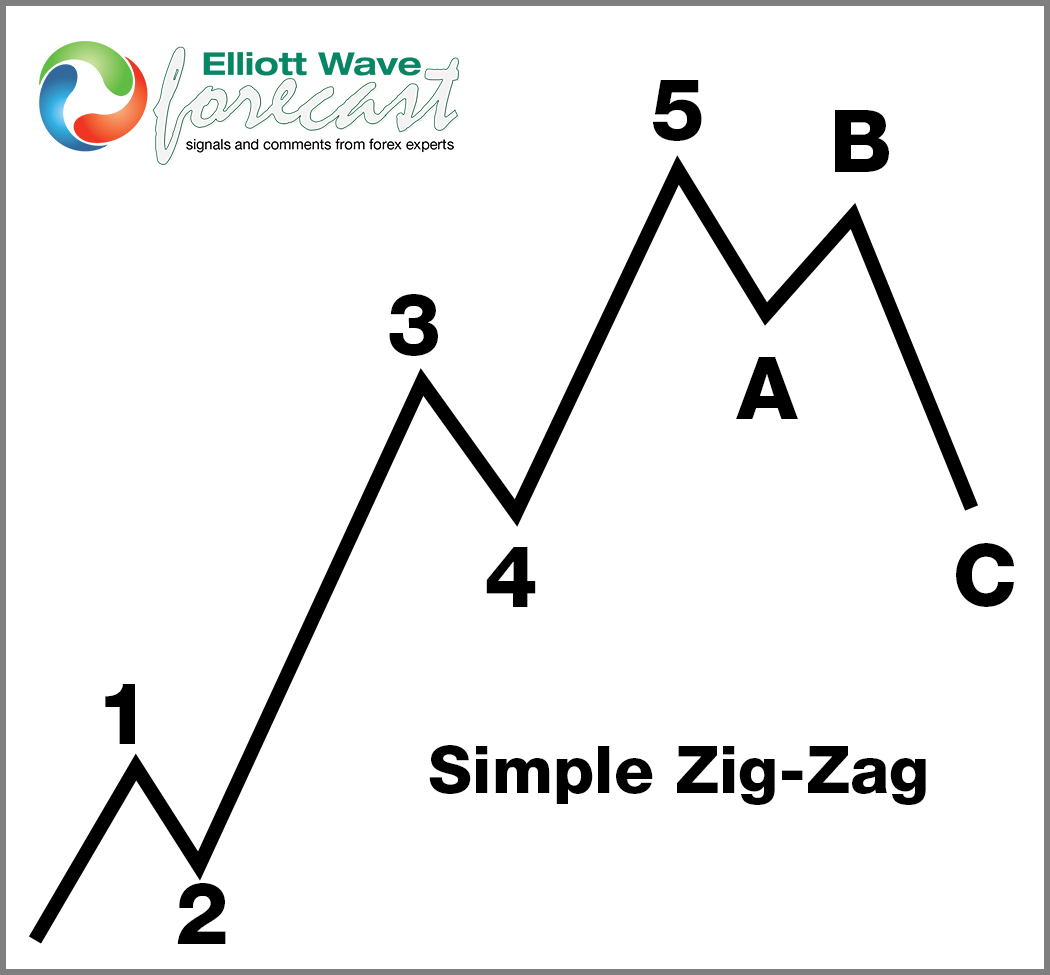
5 Wave Impulse Structure + ABC correction
$AAPL 1H Elliott Wave Chart 8.21.2025:

In the 1-hour Elliott Wave count from August 21, 2025, we saw that $AAPL completed a 5-wave impulsive cycle at red 3. As expected, this initial wave prompted a pullback. We anticipated this pullback to unfold in 3 swings and find buyers in the equal legs area between $227.23 and $223.59
This setup aligns with a typical Elliott Wave correction pattern (ABC), in which the market pauses briefly before resuming its primary trend.
$AAPL 1H Elliott Wave Chart 8.25.2025:
The next update, shows the stock is finding support from the equal legs area as predicted allowing traders to get risk free. Currently, it is looking for an impulsive rally towards 238 – 242 before another pullback takes place.
Conclusion
In conclusion, our Elliott Wave analysis of Apple Inc. ($AAPL) suggested that it remains supported against August 01, 2025 lows. Traders can apply Elliott Wave Theory to better anticipate the structure of upcoming moves. They can also enhance risk management in volatile markets.