
In recent years, the USDCNH paused its long-term attempt to strengthen against the USD. Back in February 2014, it found support at 6.0153, marking wave ((III)). What followed was textbook Elliott Wave: a zig-zag corrective structure that reached equal legs at 7.1964 in September 2019.
At that point, many expected the downtrend to resume. But renminbi had other plans.
Instead of continuing lower, the pair broke above the 7.1964 high, invalidating the simple correction thesis and hinting at something deeper: a double correction structure.
What does this mean?
- The break above 7.1964 suggests the renminbi is undergoing a complex correction, not a trend reversal.
- This opens the door to further upside in the short-to-medium term, before any sustained strengthening resumes.
- Traders should watch for internal wave subdivisions and confirmation of the second corrective leg.
When a zig-zag fails to hold, expect complexity. Double corrections often trap trend followers, structure matters more than sentiment.
USDCNH July 2023 Weekly Chart
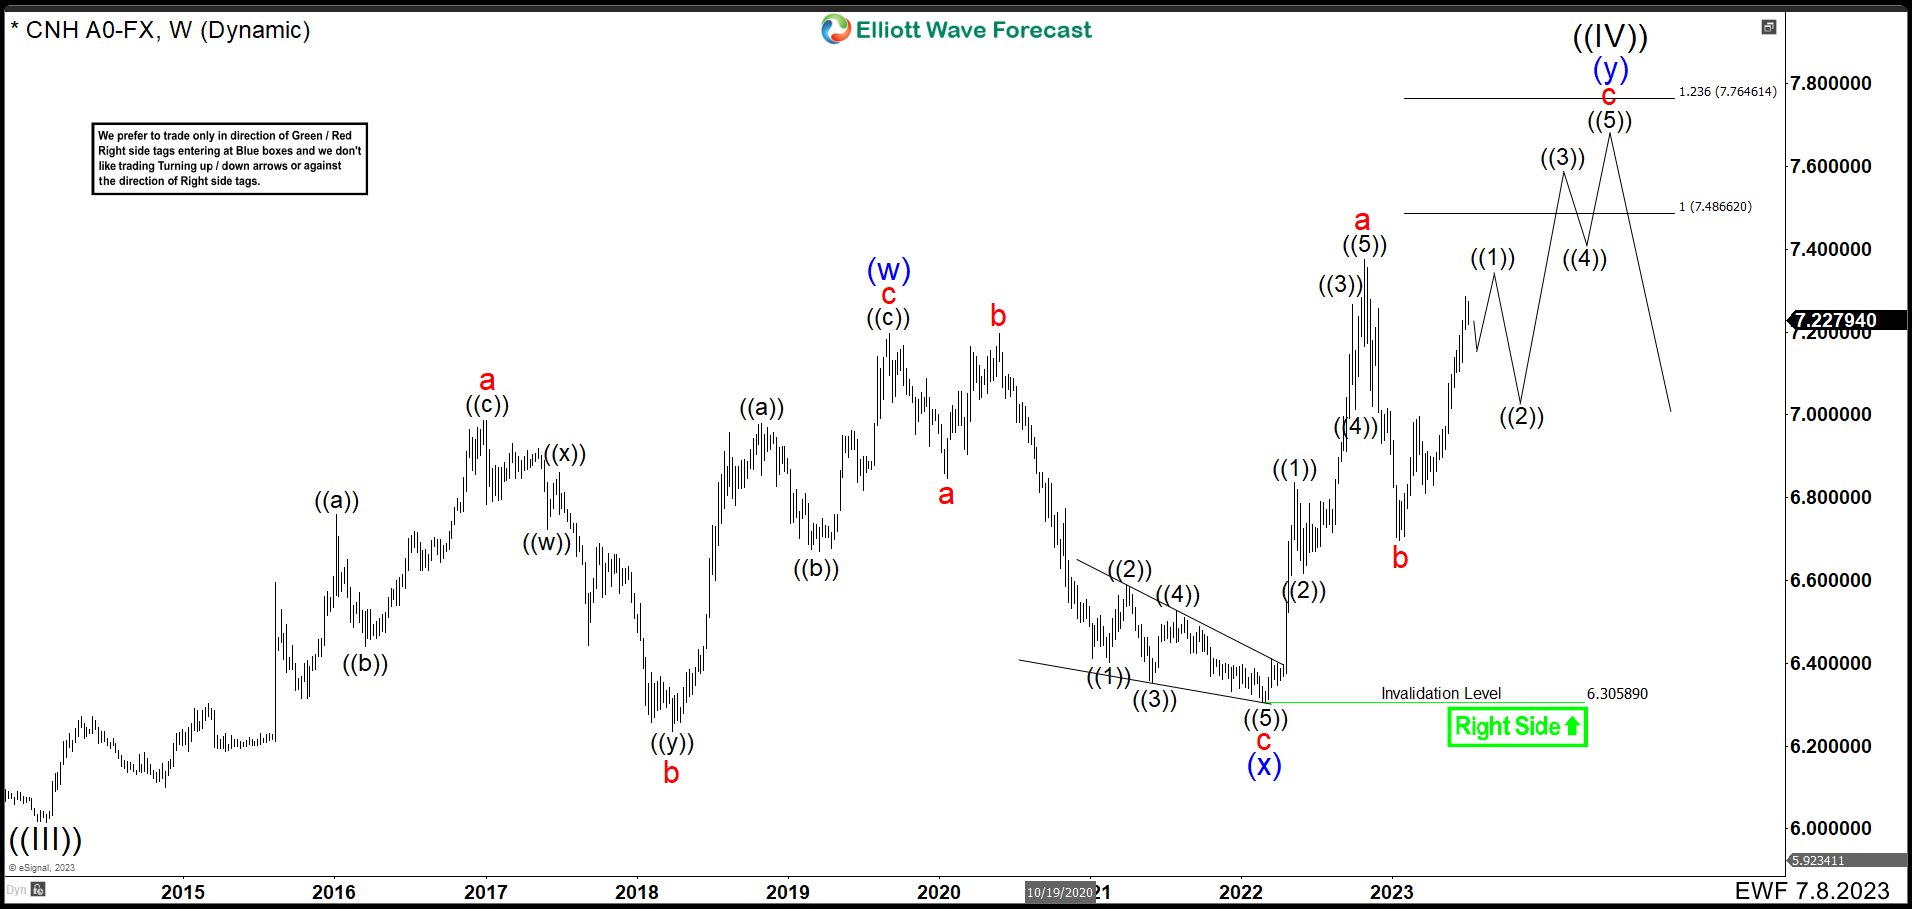
Since July 2023, USDCNH has extended its complex correction. After wave (w) peaked at 7.1974, the pair dropped in an expanded flat for wave (x), ending with a diagonal bounce from 6.3058. Momentum shifted quickly, wave “a” impulsed to 7.3748, breaking above wave (w) and confirming the bullish sequence. Wave “b” retraced to 6.6883 before price resumed higher. USDCNH is targeting the 7.4866–7.7646 zone to complete wave “c”, wave (y), and wave ((IV)), before the renminbi resumes its broader downtrend.
USDCNH March 2025 Weekly Chart
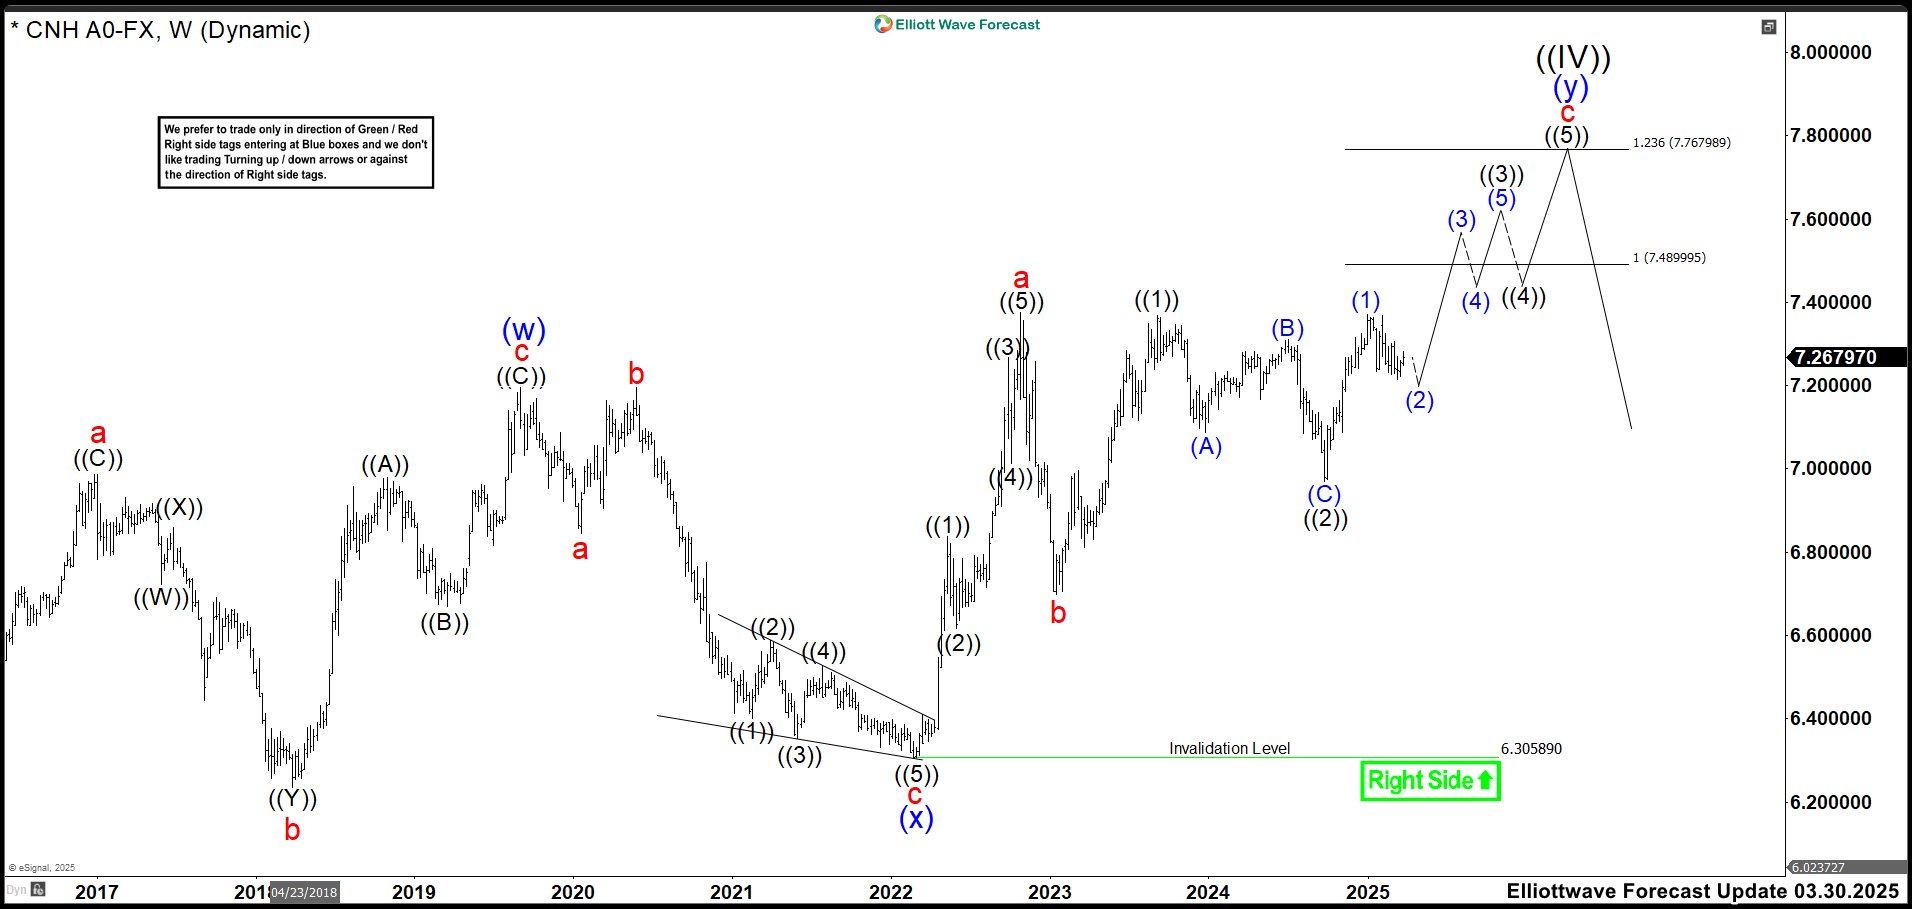
In March 2025, USDCNH rallied in wave (1) of ((3)), reaching the 7.3700 high. The move showed strength, but failed to break new highs, an early sign of hesitation. A pullback followed, likely wave (2) of ((3)), as the dollar posted its worst quarterly drop since 1973. Despite the dollar’s sharp depreciation, USDCNH didn’t mirror the move. This divergence suggests underlying strength in the renminbi’s corrective structure. The pair held firm, preserving its bullish sequence.
USDCNH July 2025 Weekly Chart

The weekly chart shows a clear breakout above the 2022 highs. This signals more upside ahead. The move broke out in a corrective fashion. Wave (2) formed an expanded flat, as you can watch on the chart. As long as USDCNH stays above wave ‘b’ at 6.6883, we expect bullish continuation. Why use the lows of wave ‘b’ and wave ((2)) as pivots? Because until price breaks above wave B’s high, we can’t rule out an expanded flat for wave ((2)). For now, we stay bullish. We expect wave (3) of ((3)) to lead the next rally. Our target remains 7.4866–7.7646. That zone would complete the correction that began in 2014.
Source: https://elliottwave-forecast.com/forex/usdcnh-resuming-bullish-path-toward-7-76/