
Hello fellow traders. In this technical article we’re going to look at the Elliott Wave charts of USDSEK forex pair published in members area of the website. As our members know USDSEK is still trading within the cycle from the 11.3229 peak. The pair has been giving us a decline as we expected. In the following text, we’ll explain the Elliott Wave analysis and present target areas.
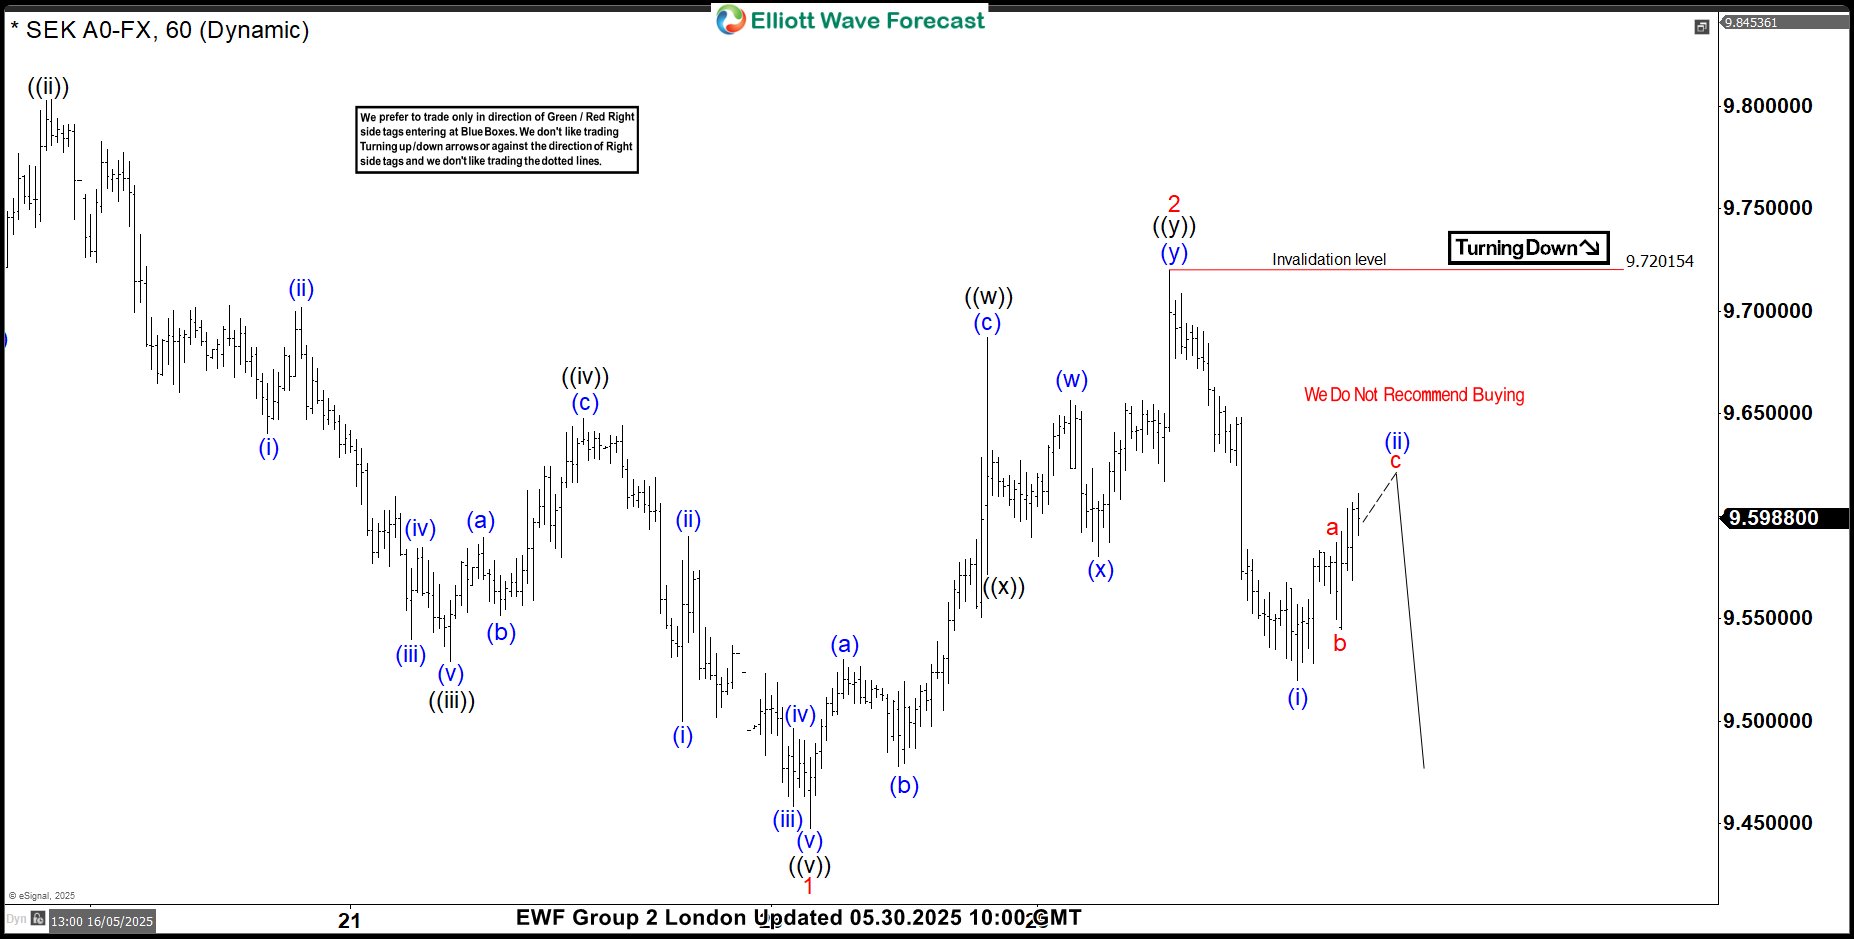
USDSEK Elliott Wave 1 Hour Chart 05.30.2025
USDSEK completed wave 2 red correction at the 9.72015 peak. We got 5 waves decline from that peak, labeled as (i) blue and currently , it’s forming a three-wave bounce – (ii) blue. Short term bounce can complete around 50-61.8 fibs zone that comes at 9.63015-9.6519. From the mentioned zone we expect to see further decline toward new lows ideally.
You can learn more about Elliott Wave Patterns at our Free Elliott Wave Educational Web Page
90% of traders fail because they don’t understand market patterns. Are you in the top 10%? Test yourself with this advanced Elliott Wave Test
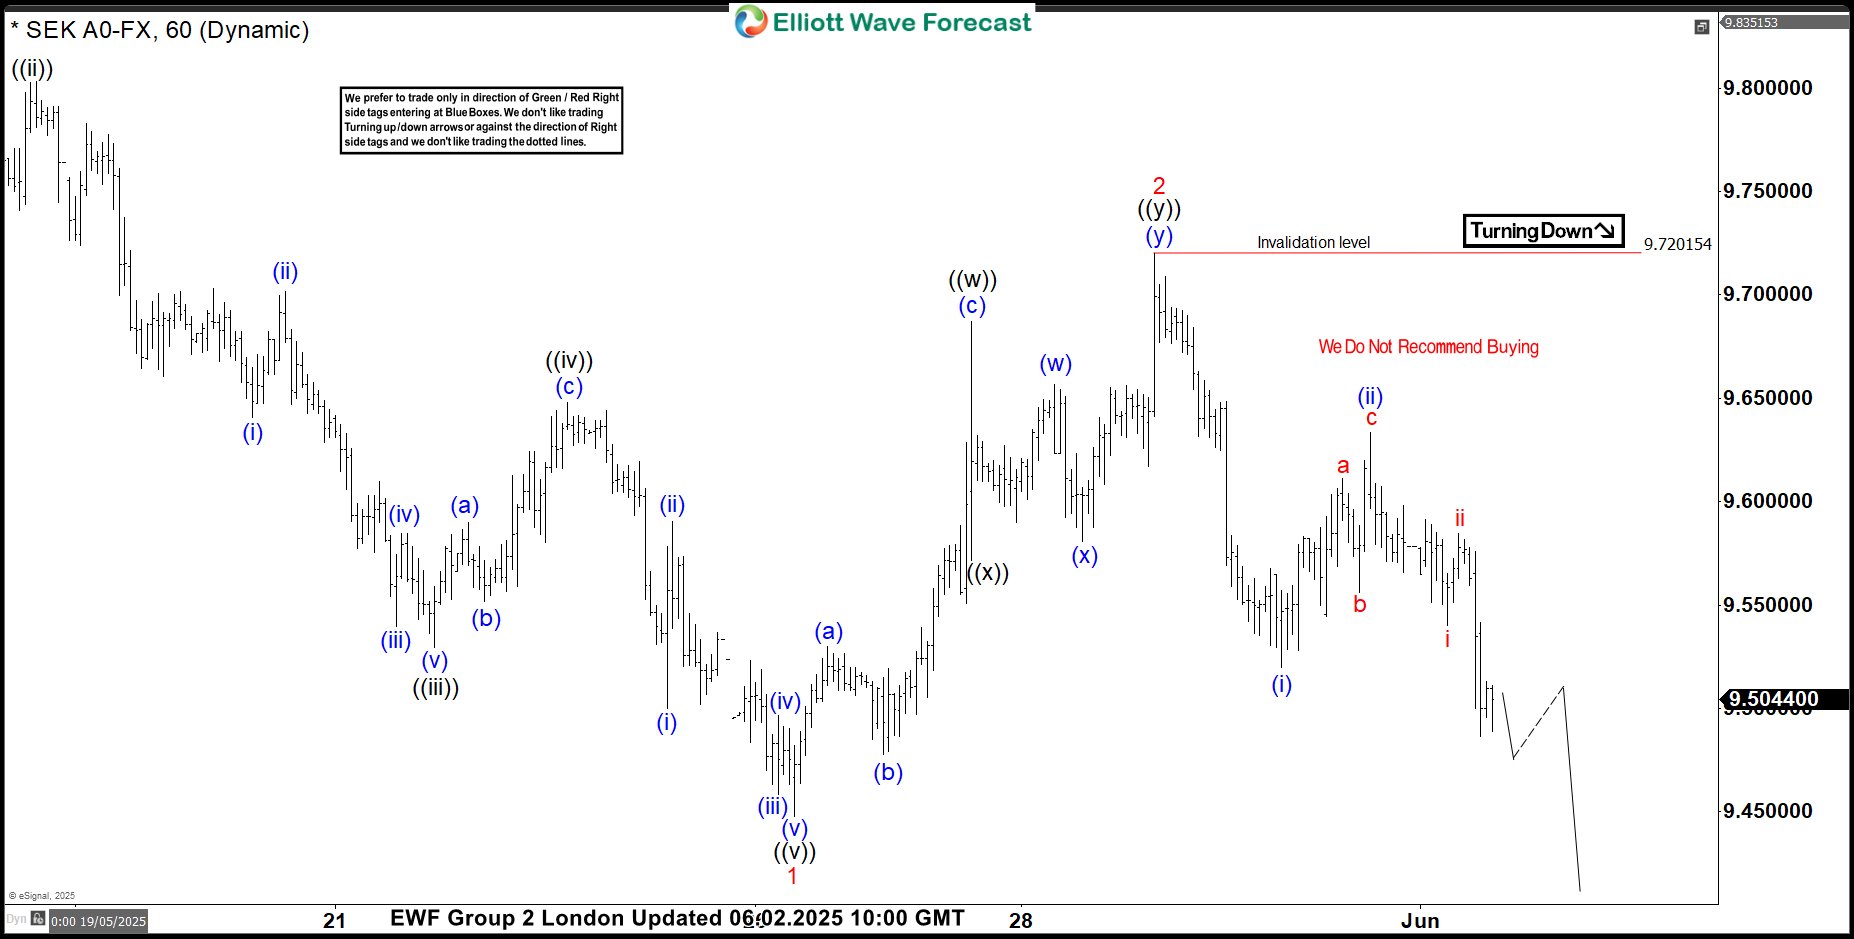
USDSEK Elliott Wave 1 Hour Chart 06.02.2025
The pair found sellers as expected and has delivered a decent decline so far. We now look for a break below the May 26th low to confirm a further extension to the downside. The pair is targeting 9.407-9.3101 area next.
Remember, the market is dynamic, and the presented view may have changed in the meantime. For the most recent charts and target levels, please refer to the membership area of the site. The best instruments to trade are those with incomplete bullish or bearish swing sequences. We put them in Sequence Report and best among them are presented in the Live Trading Room
Reminder for members: Our chat rooms in the membership area are available 24 hours a day, providing expert insights on market trends and Elliott Wave analysis. Don’t hesitate to reach out with any questions about the market, Elliott Wave patterns, or technical analysis. We’re here to help.
Source: https://elliottwave-forecast.com/forex/usdsek-elliott-wave-bearish-breakout/