
The Magnificent Seven ETF (MAGS) offers investors targeted exposure to a select group of seven leading U.S. technology and growth companies. These corporations are often regarded as market pacesetters driving innovation and performance. Designed to capitalize on the strength of these industry giants, MAGS has garnered attention for its concentrated approach. The ETF aims to deliver robust returns by focusing on firms with significant influence in their sectors. Recently, it has emerged from a correction triggered by a tariff war announcement. The ETF showcased resilience as it embarks on what appears to be an impulsive rally. With momentum building, investors are closely watching whether MAGS can surpass its previous all-time high. Only break to new high confirms that the low is firmly in place, signaling a potential continuation of its upward trajectory. We will take a look at the technical outlook using Elliott Wave below:
MAGS Weekly Elliott Wave Chart
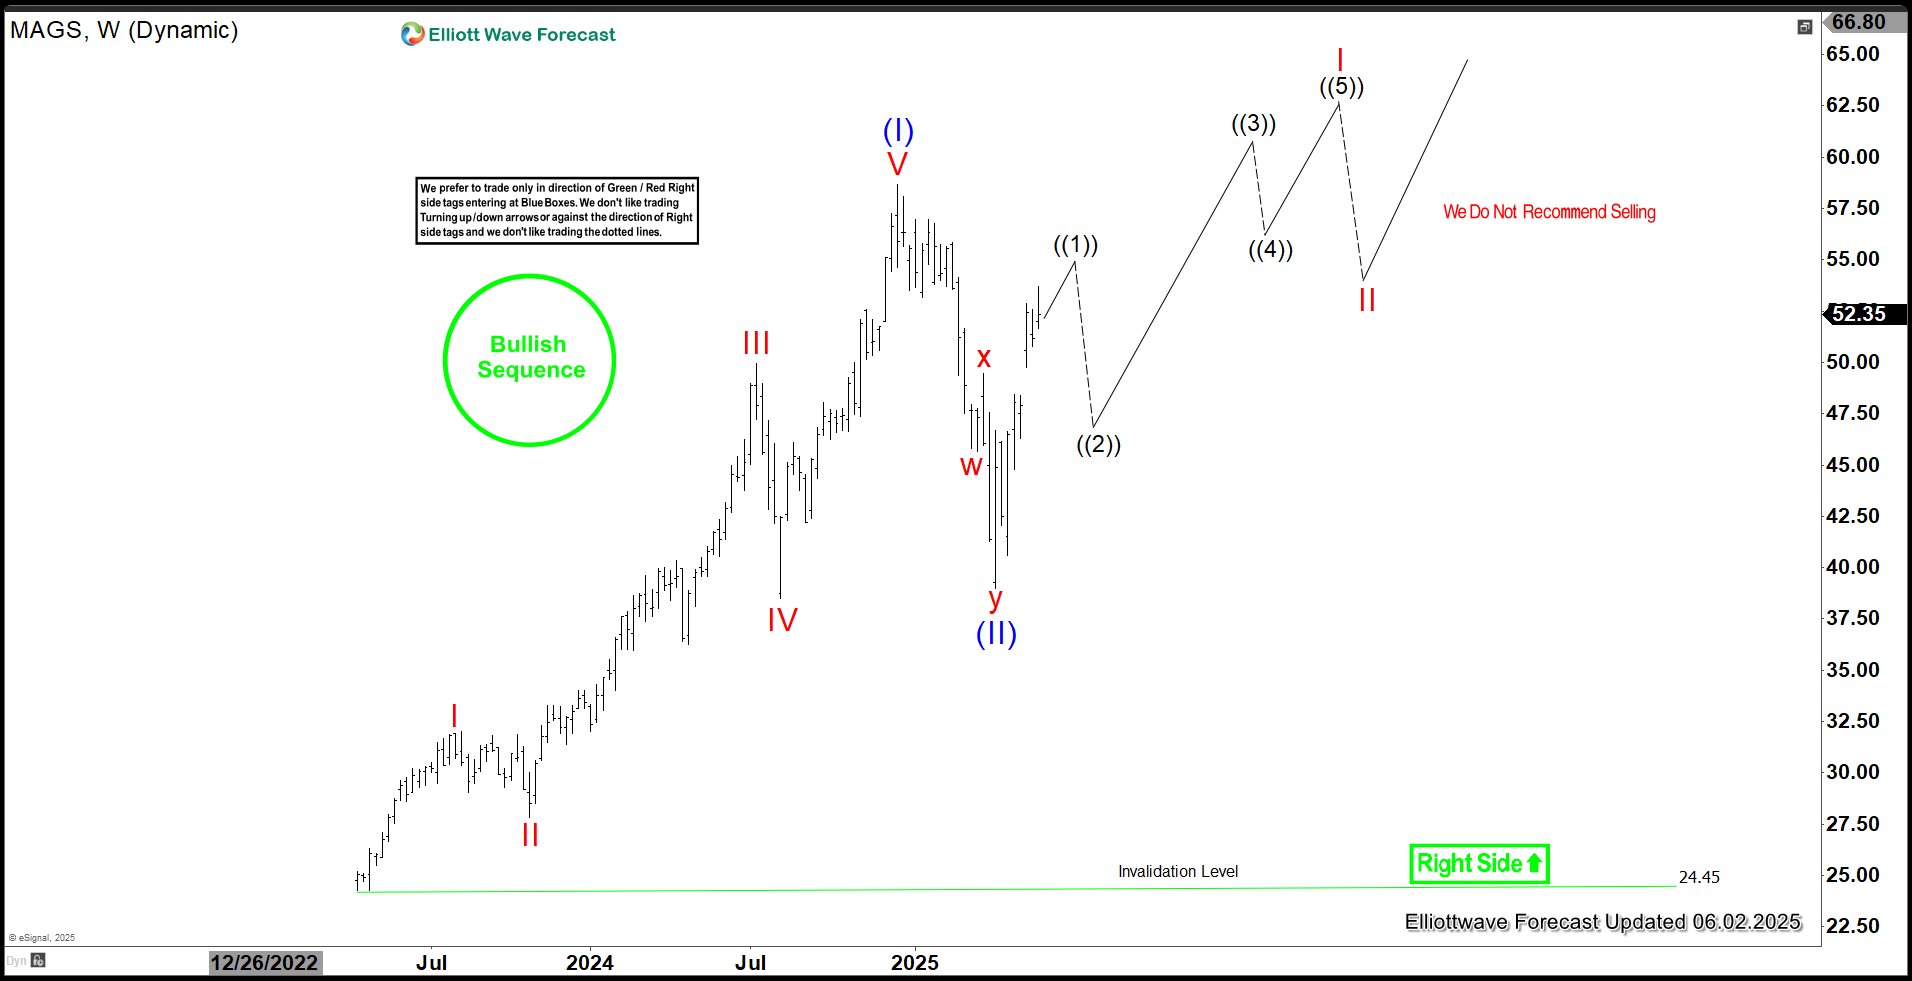
The weekly Elliott Wave chart for the Magnificent Seven ETF (MAGS) illustrates a completed five-wave impulse in wave (I), peaking at an all-time high of $58.69. The subsequent pullback in wave (II) appears to have concluded at $39. Currently, MAGS has turned upward, potentially initiating wave (III). To confirm the start of this next bullish leg and rule out a double correction, the ETF must break above the wave (I) high of $58.69. Going forward, expect any pullbacks to find support at the 3, 7, or 11 swing levels, with the ETF poised to extend higher if the breakout occurs.
MAGS Daily Elliott Wave Chart
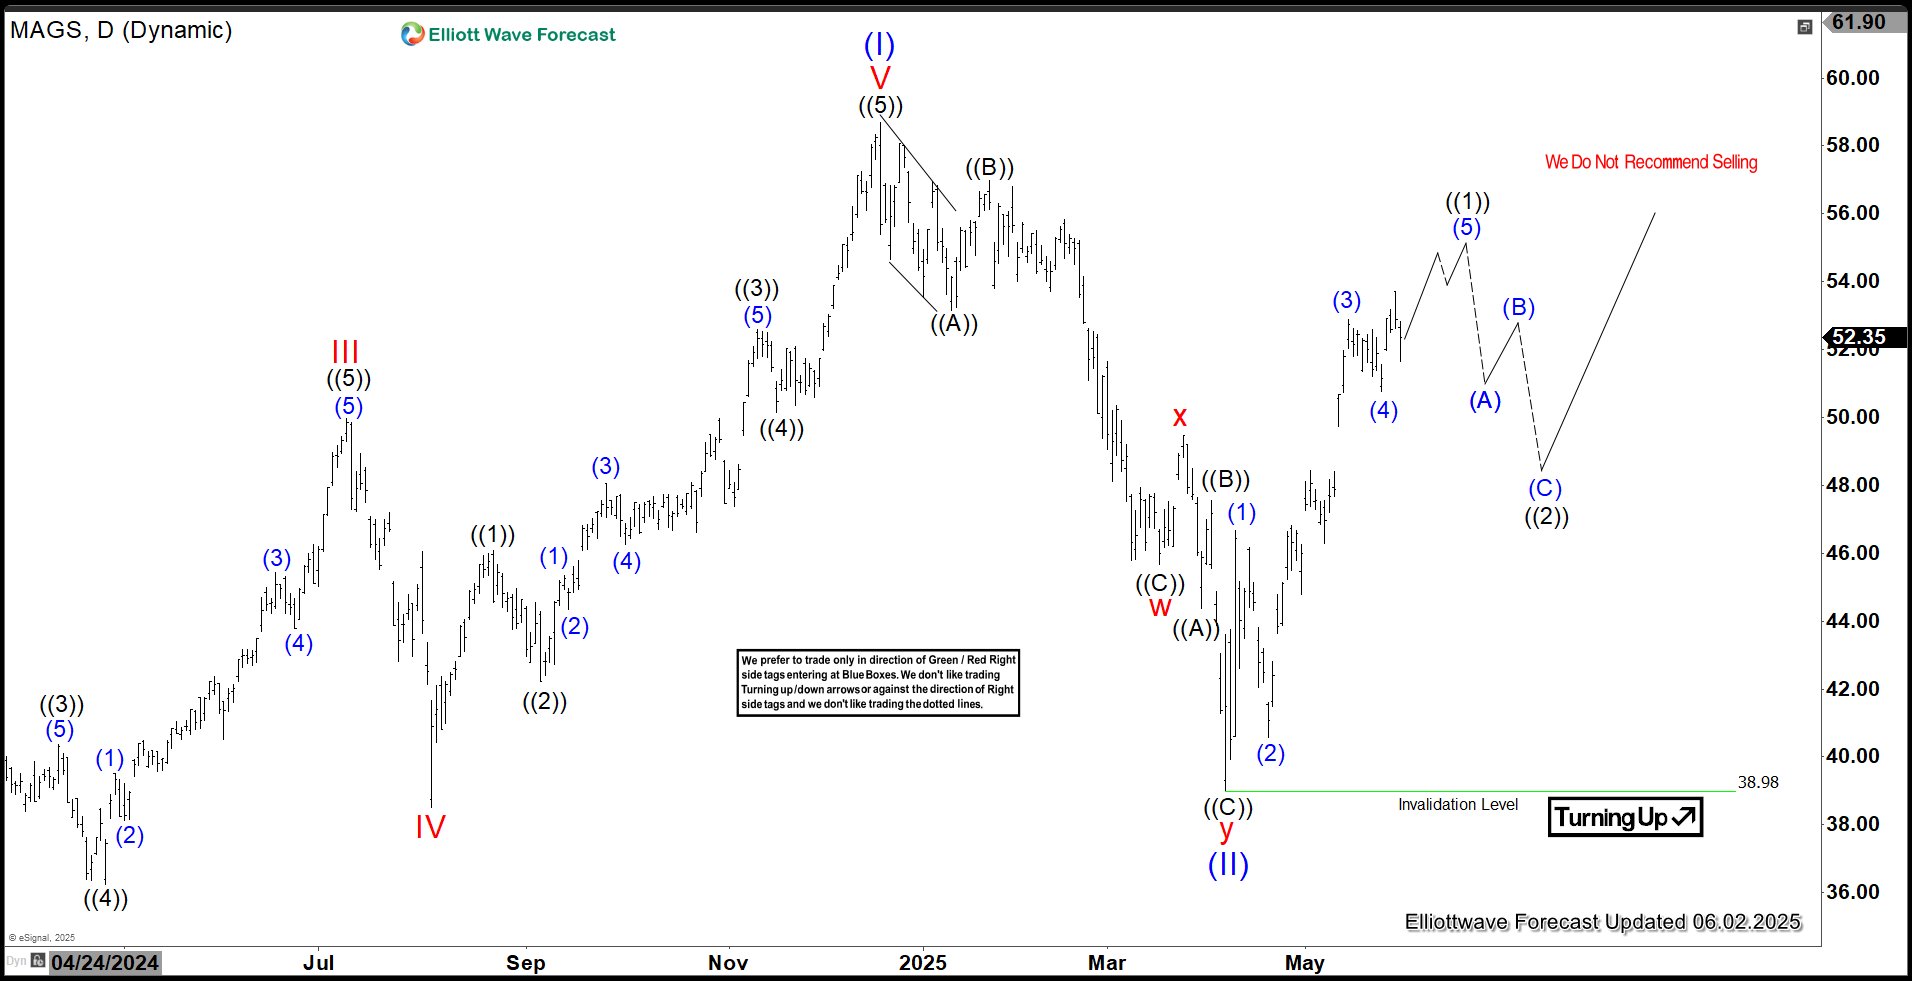
The daily Elliott Wave chart for the Magnificent Seven ETF (MAGS) details the subdivision of wave (II) as a double-three Elliott Wave structure. Following the all-time high of wave (I) at $58.69, the corrective wave (II) unfolded as a double three. Wave w declined to $45.67 and wave x rebounded to $49.46. Wave y concluded at $38.98, marking the completion of wave (II). Since then, MAGS has turned higher, initiating an impulsive rally.
From the wave (II) low, wave (1) advanced to $46.67, followed by a wave (2) pullback to $40.58. The rally continued with wave (3) reaching $52.88, and wave (4) dipped to $50.77. The ETF is now expected to complete wave (5) of ((1)). Then it should be followed by a pullback in wave ((2)) to correct the cycle from the April 7, 2025 low. Dips will likely find support at the 3, 7, or 11 swing levels. As long as the $38.98 pivot holds, dips should attract buyers at these swing levels, supporting further upside.