
Elliott Wave Forecast suggests ITC remains in a bullish cycle with further upside ahead as long as key levels hold.
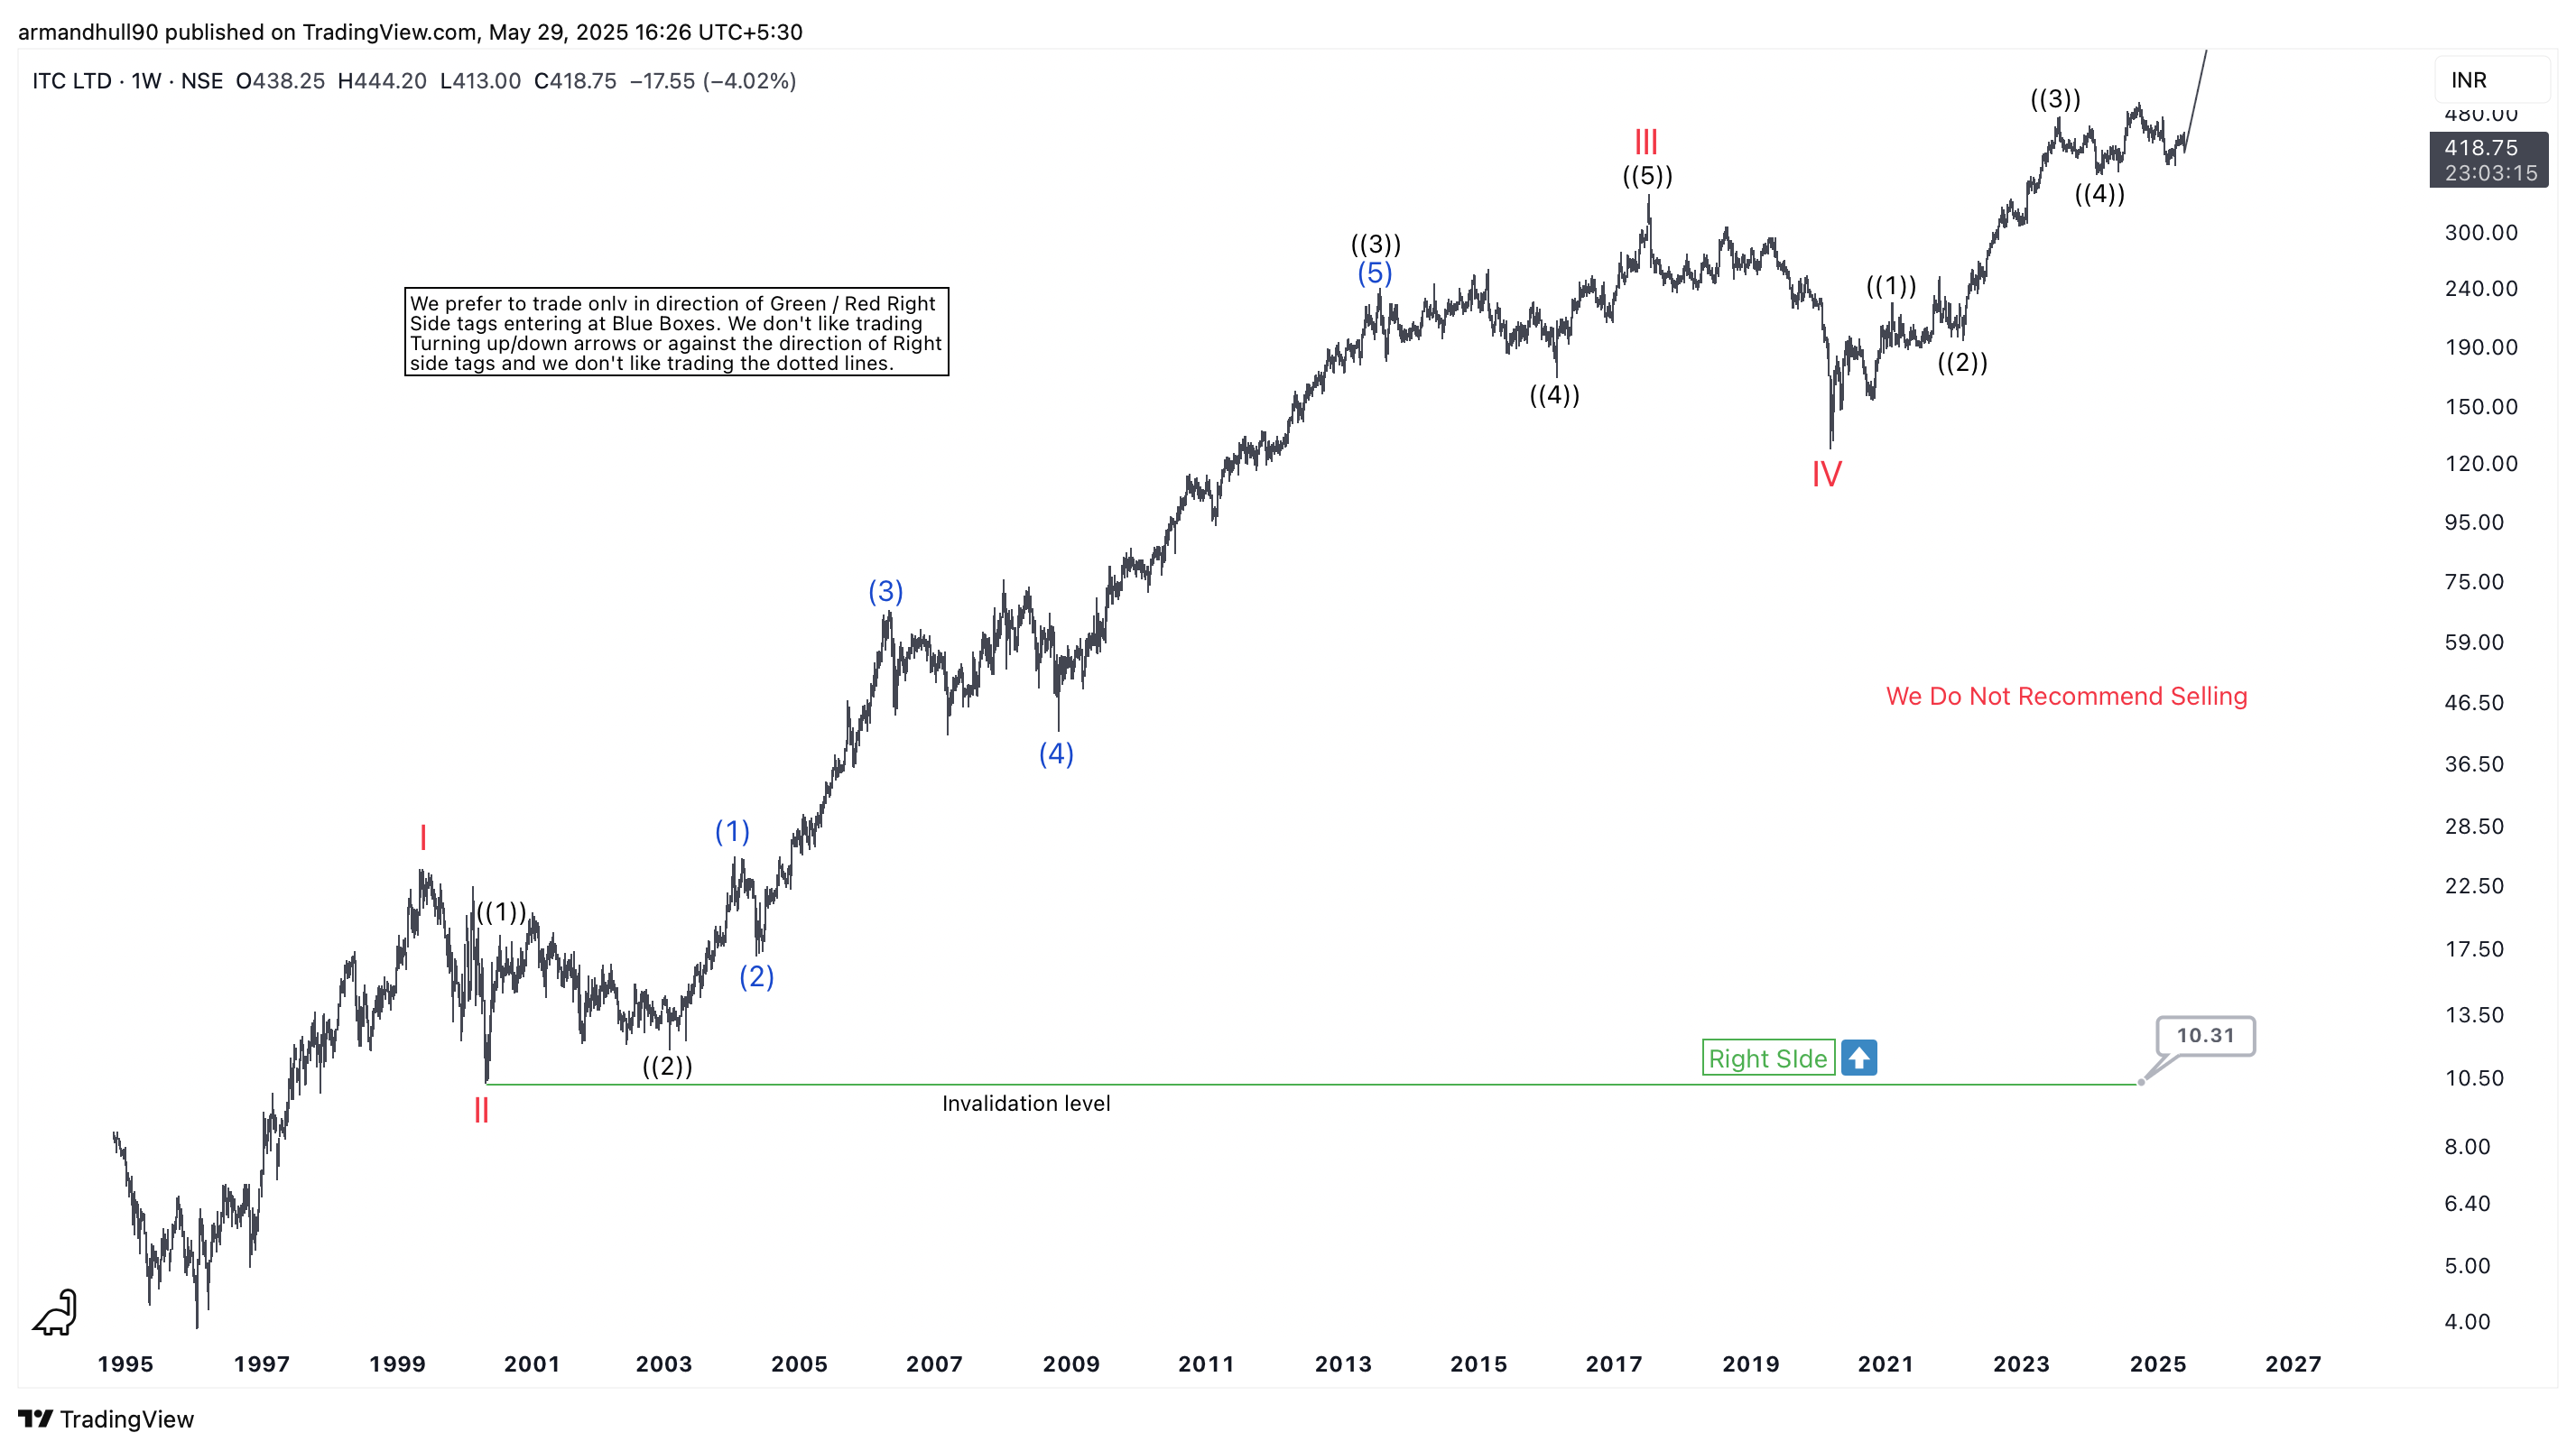
ITC Ltd (NSE: ITC) shows a powerful long-term bullish trend based on Elliott Wave analysis. The stock has followed a textbook impulse sequence since the 1990s. The wave count reveals a clear five-wave structure, suggesting more upside remains in the current cycle.
On the Weekly chart, ITC has shown a clear 5-wave advance from the lows of the early 2000s, with wave III peaking near 2022 followed by a corrective wave IV bottoming out post-2020. The price has since resumed the uptrend in what appears to be the early stages of wave V. The labeling suggests wave ((1)), ((2)), ((3)) and ((4)) of V are already completed, and wave ((5)) is currently unfolding, supported by strong momentum and higher highs.
Notably, there is a “Right Side” tag placed at 10.31 INR, establishing this level as the long-term invalidation point for the bullish view. As long as this level holds, the structure favors higher prices, and we do not recommend selling.
The Daily chart adds further confirmation. Following the low of wave IV in 2020, ITC has developed a clean impulsive advance with several subwaves already completed. The latest correction labeled as wave (2) within ((5)) seems to be finishing, setting the stage for a bullish breakout toward the 500–550 INR region in the coming months.
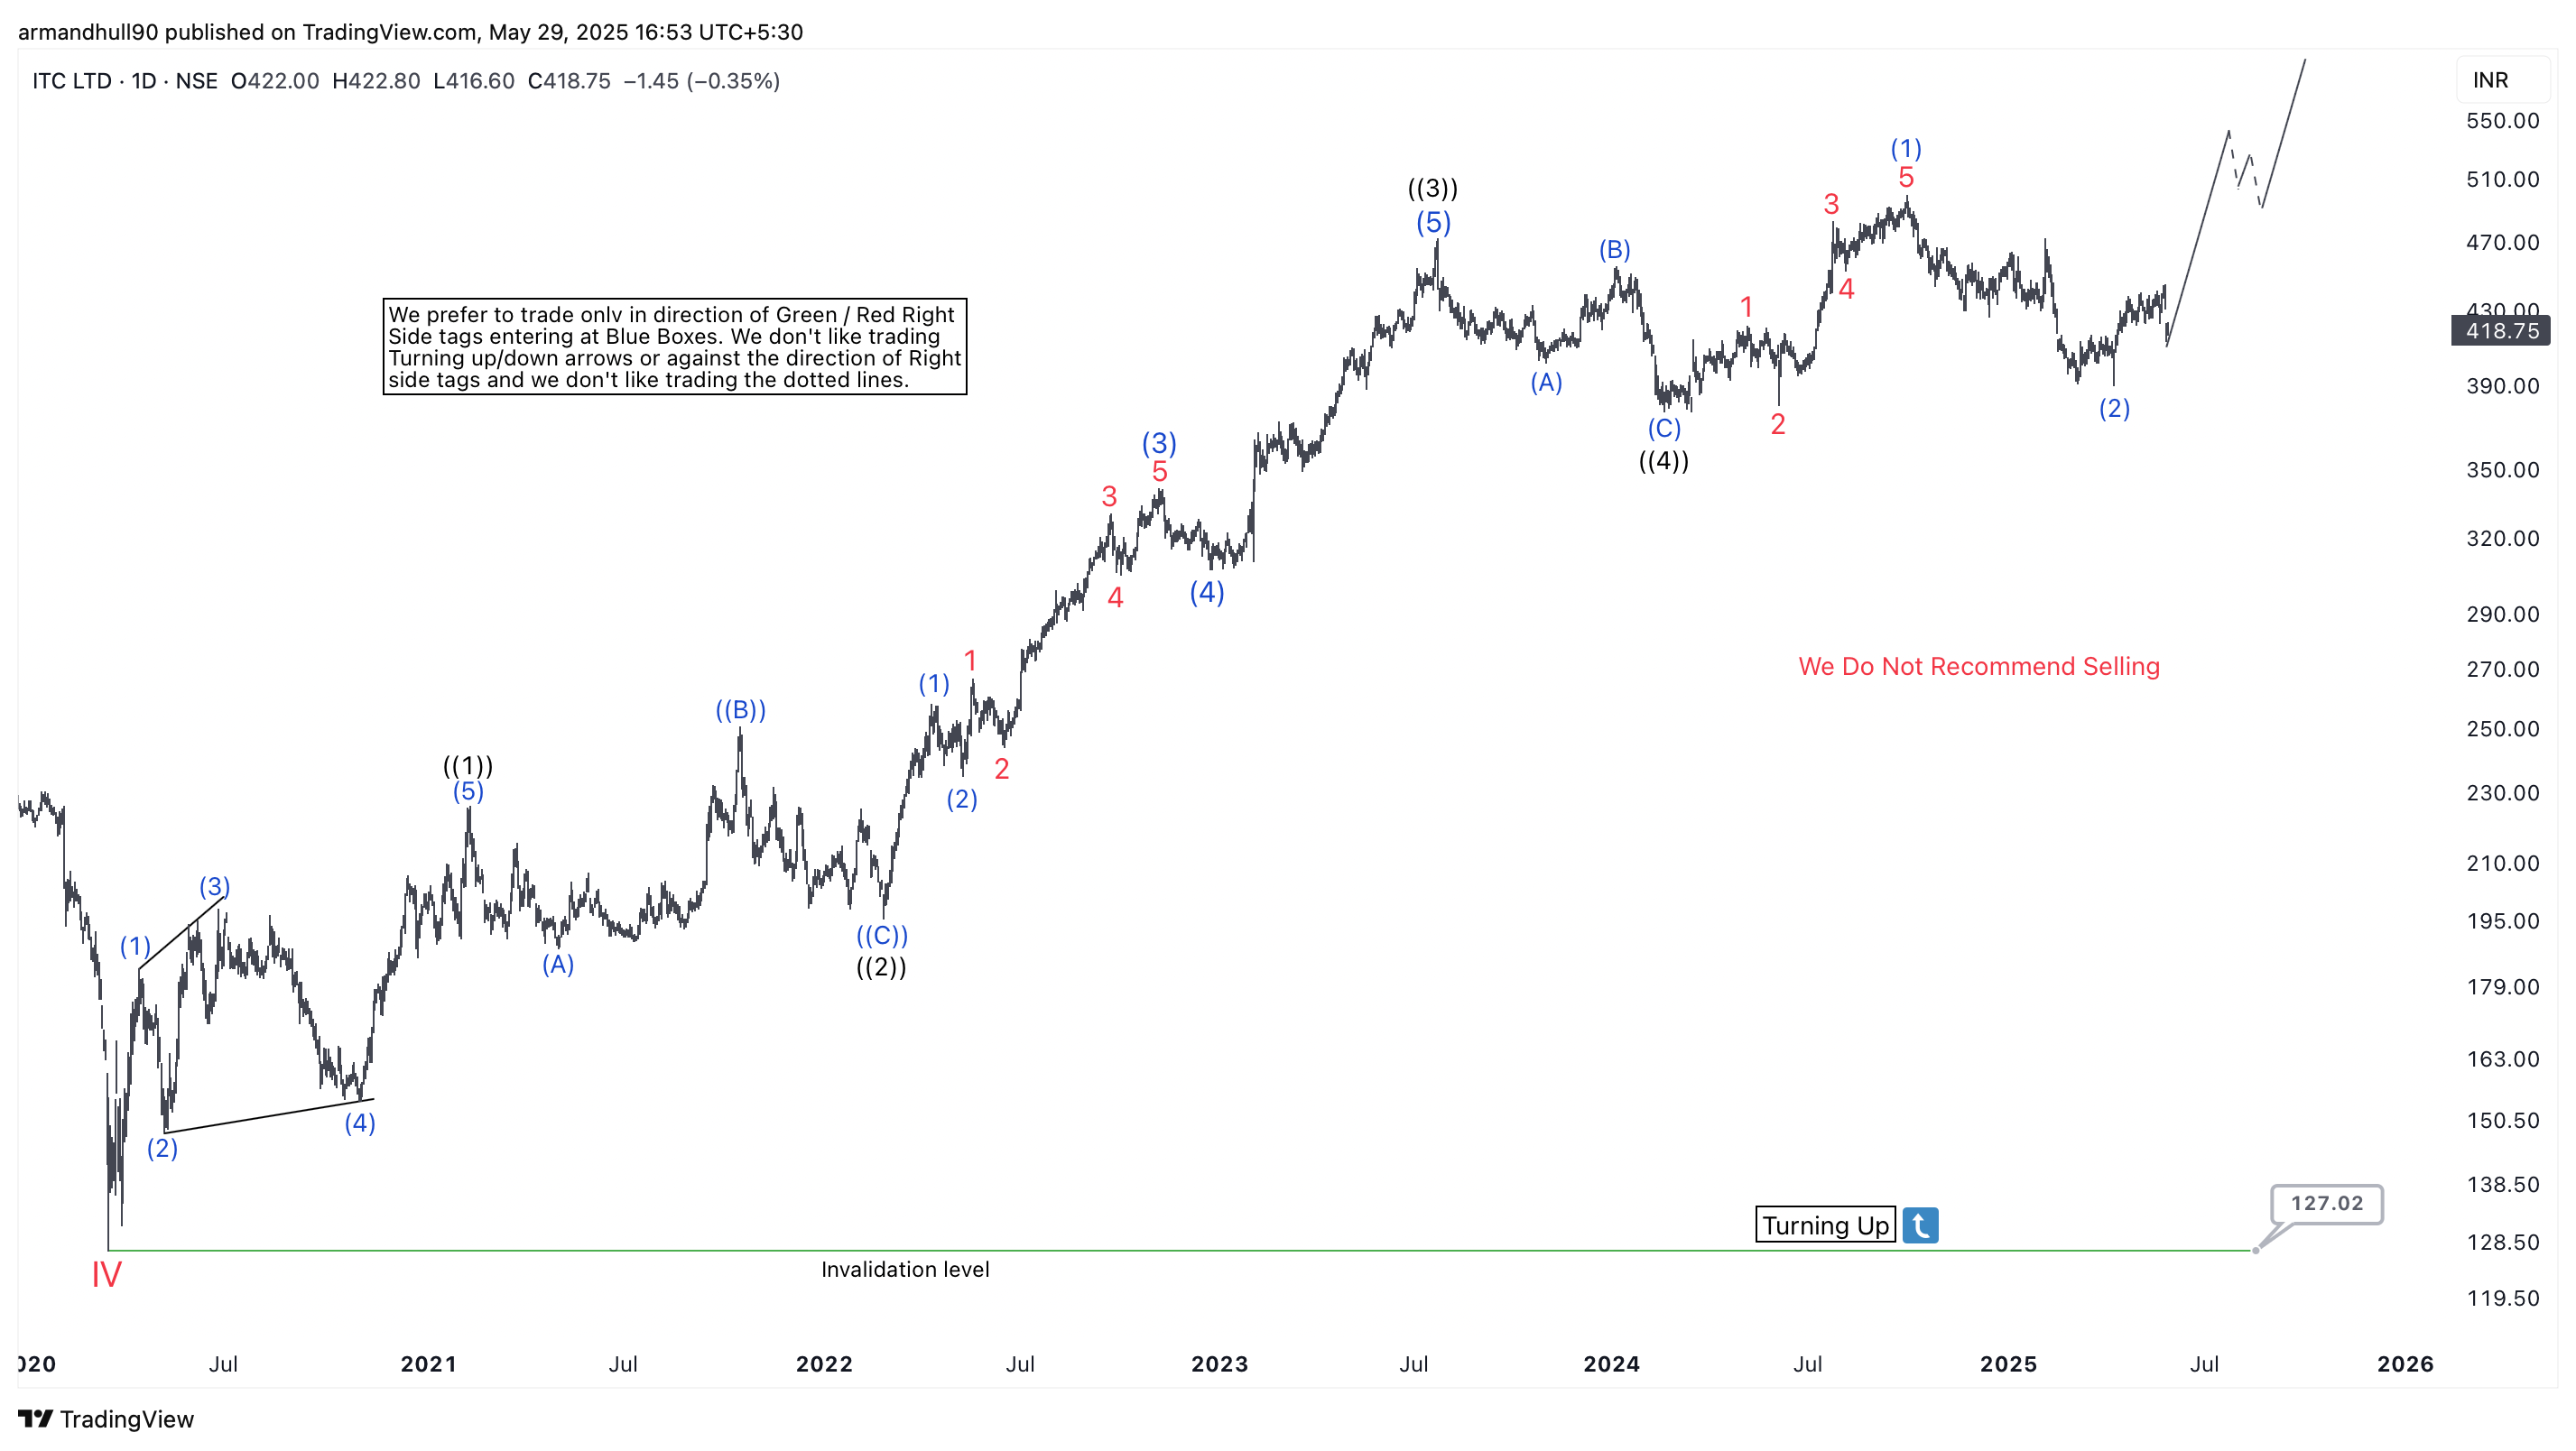
The corrective sequences have remained shallow and orderly, indicative of a market with underlying buying interest. The bullish “Turning Up” tag and “Right Side” indication align across both timeframes, reinforcing our directional bias.
Conclusion:
In conclusion, as per our Elliott Wave analysis, ITC Ltd remains in a strong upward trend. We prefer to remain buyers in blue box pullbacks and avoid trading against the Right Side tags. The structure supports further upside as long as key support and invalidation levels remain intact.