Pan American Silver Corp. (PAAS) is a mining company based in Vancouver, Canada, focused on silver, gold, zinc, lead, and copper. Founded in 1979, it handles exploration, development, extraction, processing, and refining. The company operates in Canada, Mexico, Peru, Bolivia, Argentina, Chile, and Brazil. Below we will take a look at the Elliott Wave technical outlook.
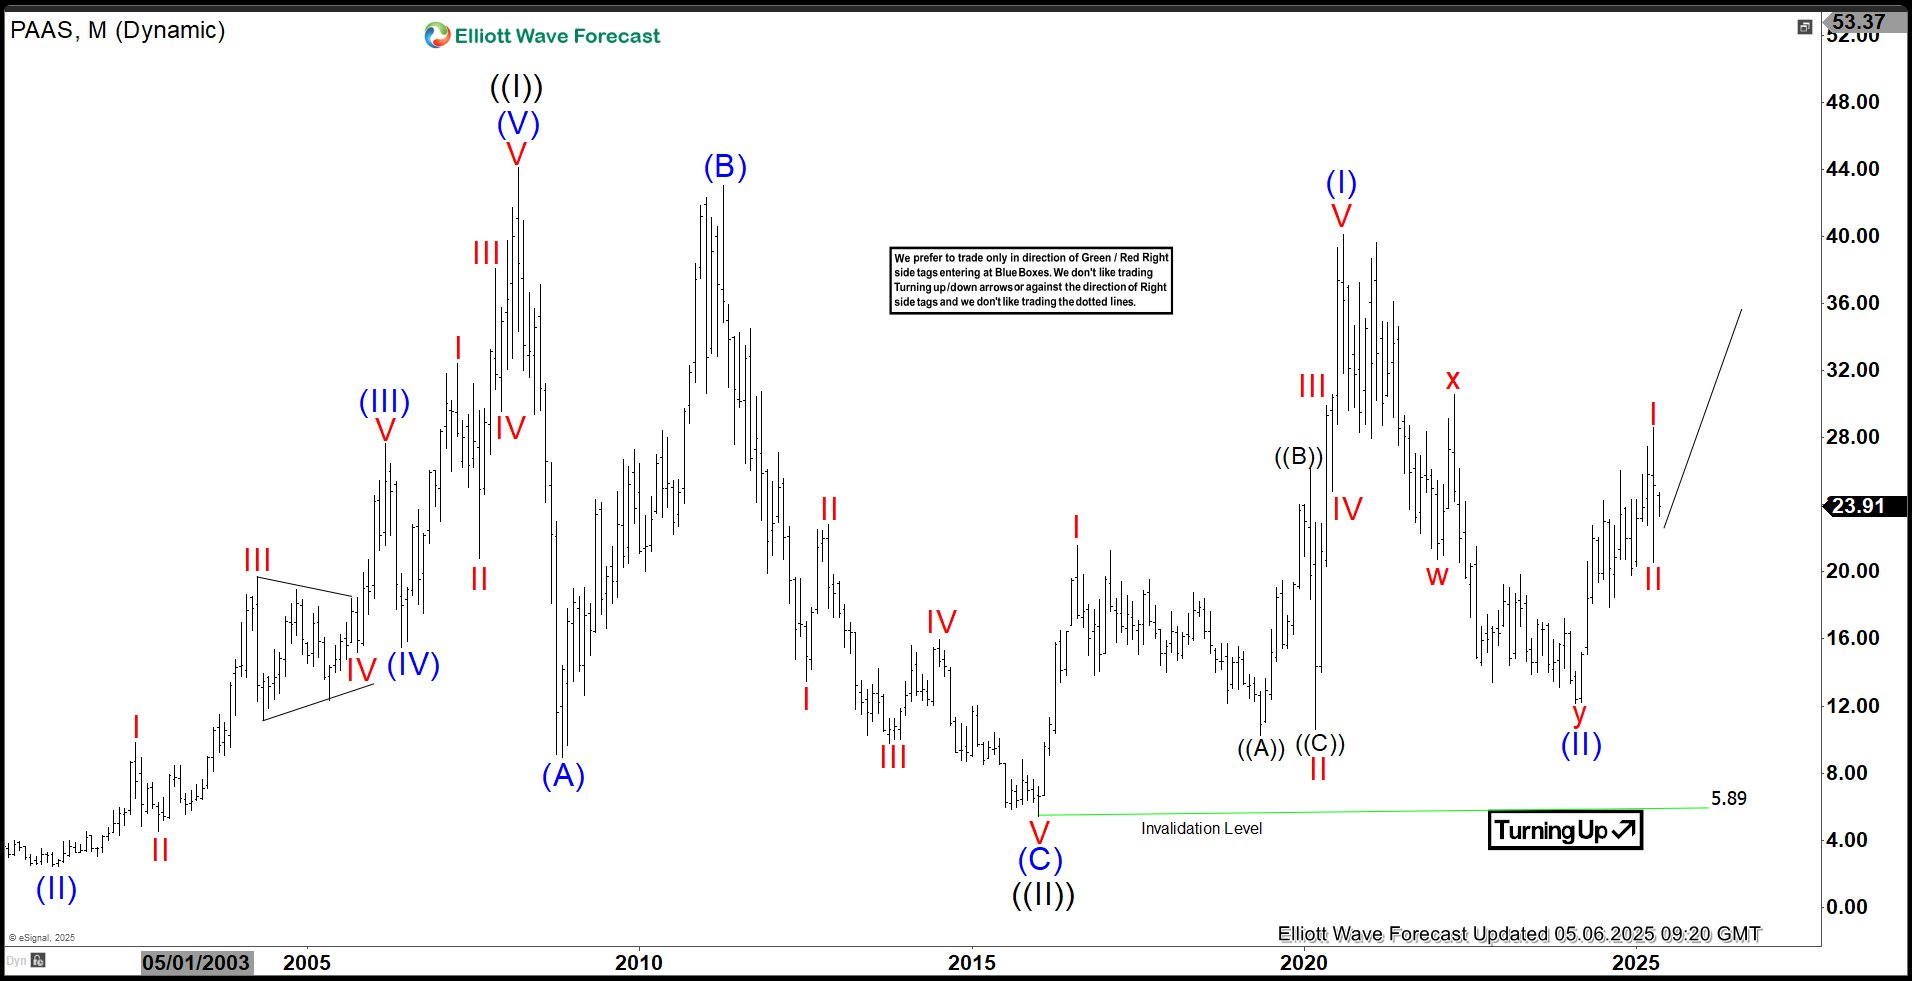
PAAS Monthly Elliott Wave Chart

The monthly Elliott Wave chart for Pan American Silver (PAAS) indicates that the wave ((II)) pullback concluded at $5.89 in January 2016. Since then, the stock has begun advancing in wave ((III)). From the wave ((II)) low, wave (I) peaked at $40.11, followed by a wave (II) pullback that bottomed at $12.16. The stock has now resumed its upward trend in wave (III). Within this wave, wave I reached $28.60, with a subsequent wave II pullback ending at $20.55. As long as the $5.89 low holds, the stock is expected to continue rising.
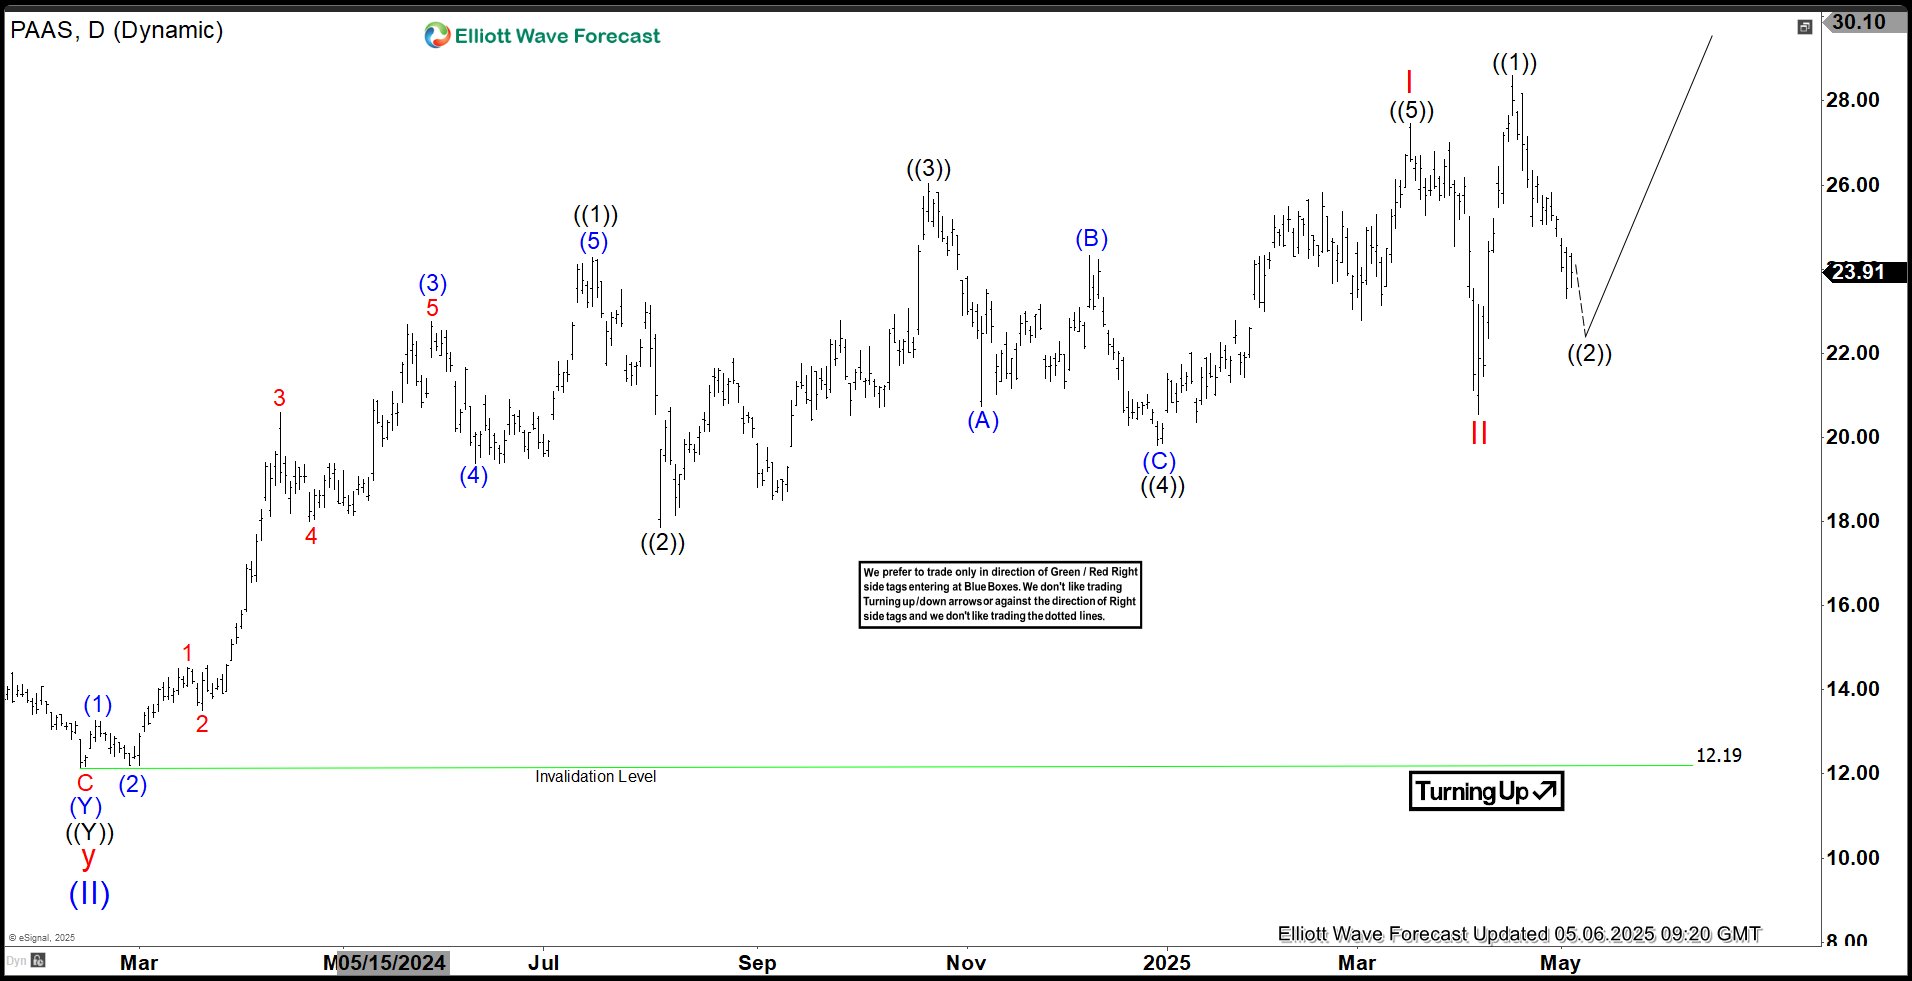
PAAS Daily Elliott Wave Chart

The daily Elliott Wave chart for Pan American Silver (PAAS) indicates that the wave (II) pullback concluded at $12.19. From this low, the stock began an upward move in wave I, structured as a diagonal pattern. Within wave I, wave ((1)) peaked at $24.27, followed by a wave ((2)) pullback to $17.86. The stock then climbed in wave ((3)) to $26.05, with a wave ((4)) dip ending at $19.80. The final wave ((5)) completed wave I at $27.47. A subsequent wave II pullback ended at $20.55. As long as the $12.19 low remains intact, the stock is expected to continue rising.
