
The Indian rupee USDINR has been experiencing notable fluctuations in recent months. As of today, the rupee has strengthened to 84 per US dollar, marking its highest level since October 2024. This appreciation is driven by heavy selling of the dollar by foreign banks and consistent foreign fund inflows.
Key Factors Influencing the Rupee:
- Foreign Investments: Increased foreign direct investment (FDI) and portfolio inflows have contributed to the rupee’s strength.
- Global Trade Developments: The possibility of China-US trade talks has improved investor sentiment, benefiting Asian currencies, including the rupee.
- Domestic Economic Indicators: India’s manufacturing PMI has risen to a 10-month high, reflecting strong demand and healthy order books.
- Geopolitical Considerations: Tensions between India and Pakistan have led to some volatility, but optimism over a potential US-India trade deal has helped stabilize the rupee.
- Oil Prices: A decline in crude oil prices has supported the rupee, reducing India’s import bill.
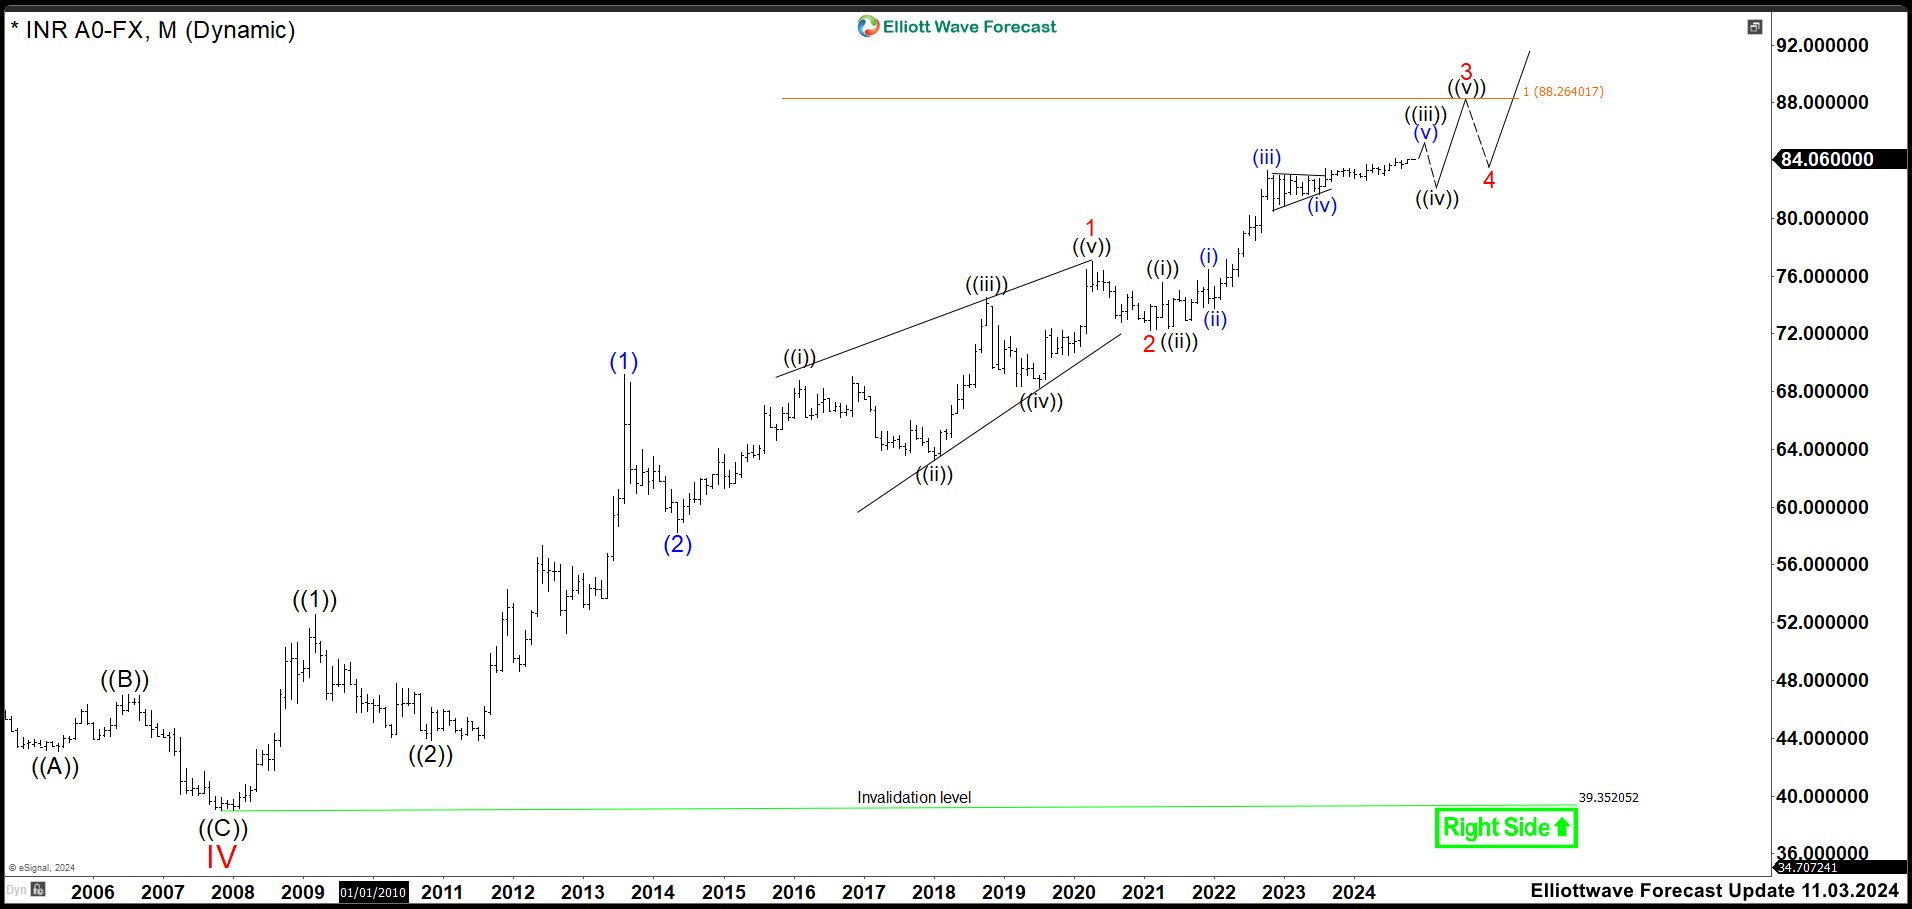
Monthly USDINR Chart November 2024
A few months ago, the price movement had formed a wave (iv) triangle instead of the flat correction we had thought before. After that, the pair had moved up, creating wave (v) of ((iii)).
If this wave pattern had been correct and there had been no extension movement, then wave (v) of ((iii)) should have finished in the 84.00 – 85.00 range. Because of this, a price pullback from those levels as wave ((iv)) would not have been surprising.
Also, if this correction had happened in 3, 7, or 11 moves, it would have been a chance to buy and aim for 88.26. In the end, even if there had been no pullback, the final target would still be 88.26.
Monthly USDINR Chart May 2025
Scenario 1:
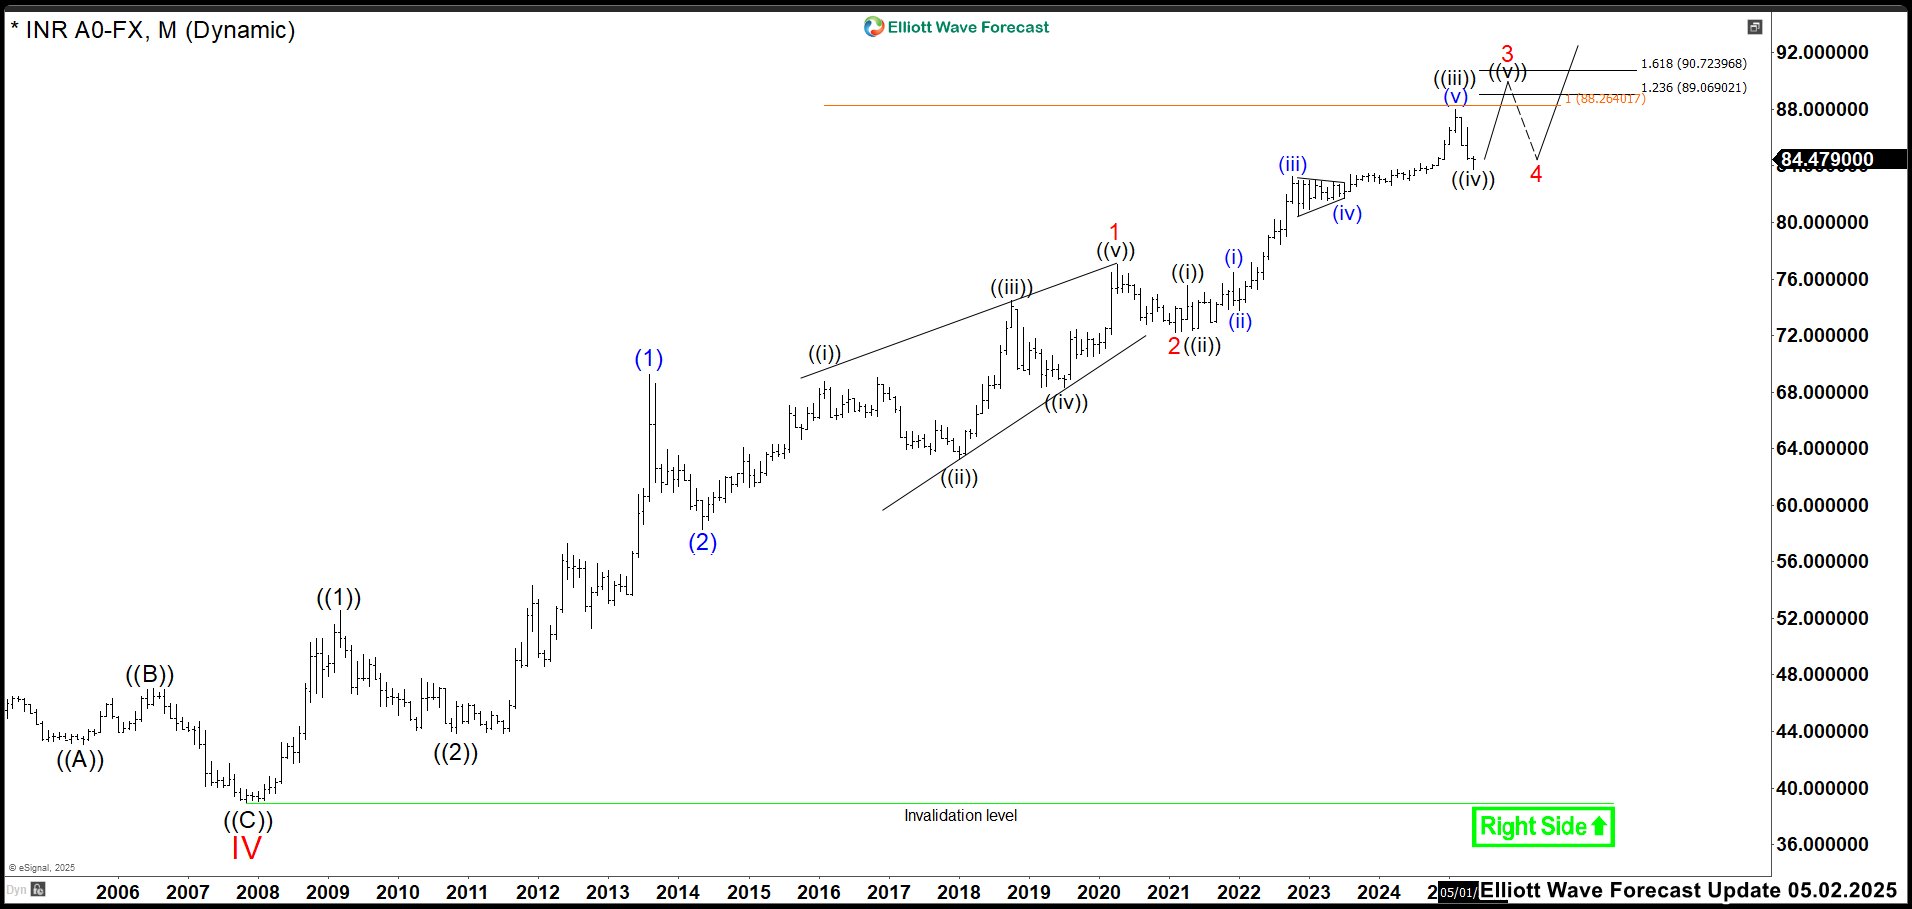
The current analysis shows that wave (v) of ((iii)) extended to 87.97, missing the target by 29 cents, before reversing lower. The correction in wave ((iv)) nearly reached the 100% Fibonacci extension at 83.76, and then strongly rebounded, suggesting that wave ((iv)) has likely been completed.
As a result, USDINR should continue its upward movement in wave ((v)), ideally reaching the 89.06 – 90.72 range—assuming there are no further extensions in wave ((v)). At this level, the strength of the dollar is expected to be rejected by the market, completing wave 3 and starting the correction in wave 4.
Furthermore, wave 4 should test the support of the previous wave ((iv)) before the upward momentum resumes in wave 5. This progression will confirm the continuation of the bullish trend.
Scenario 2:
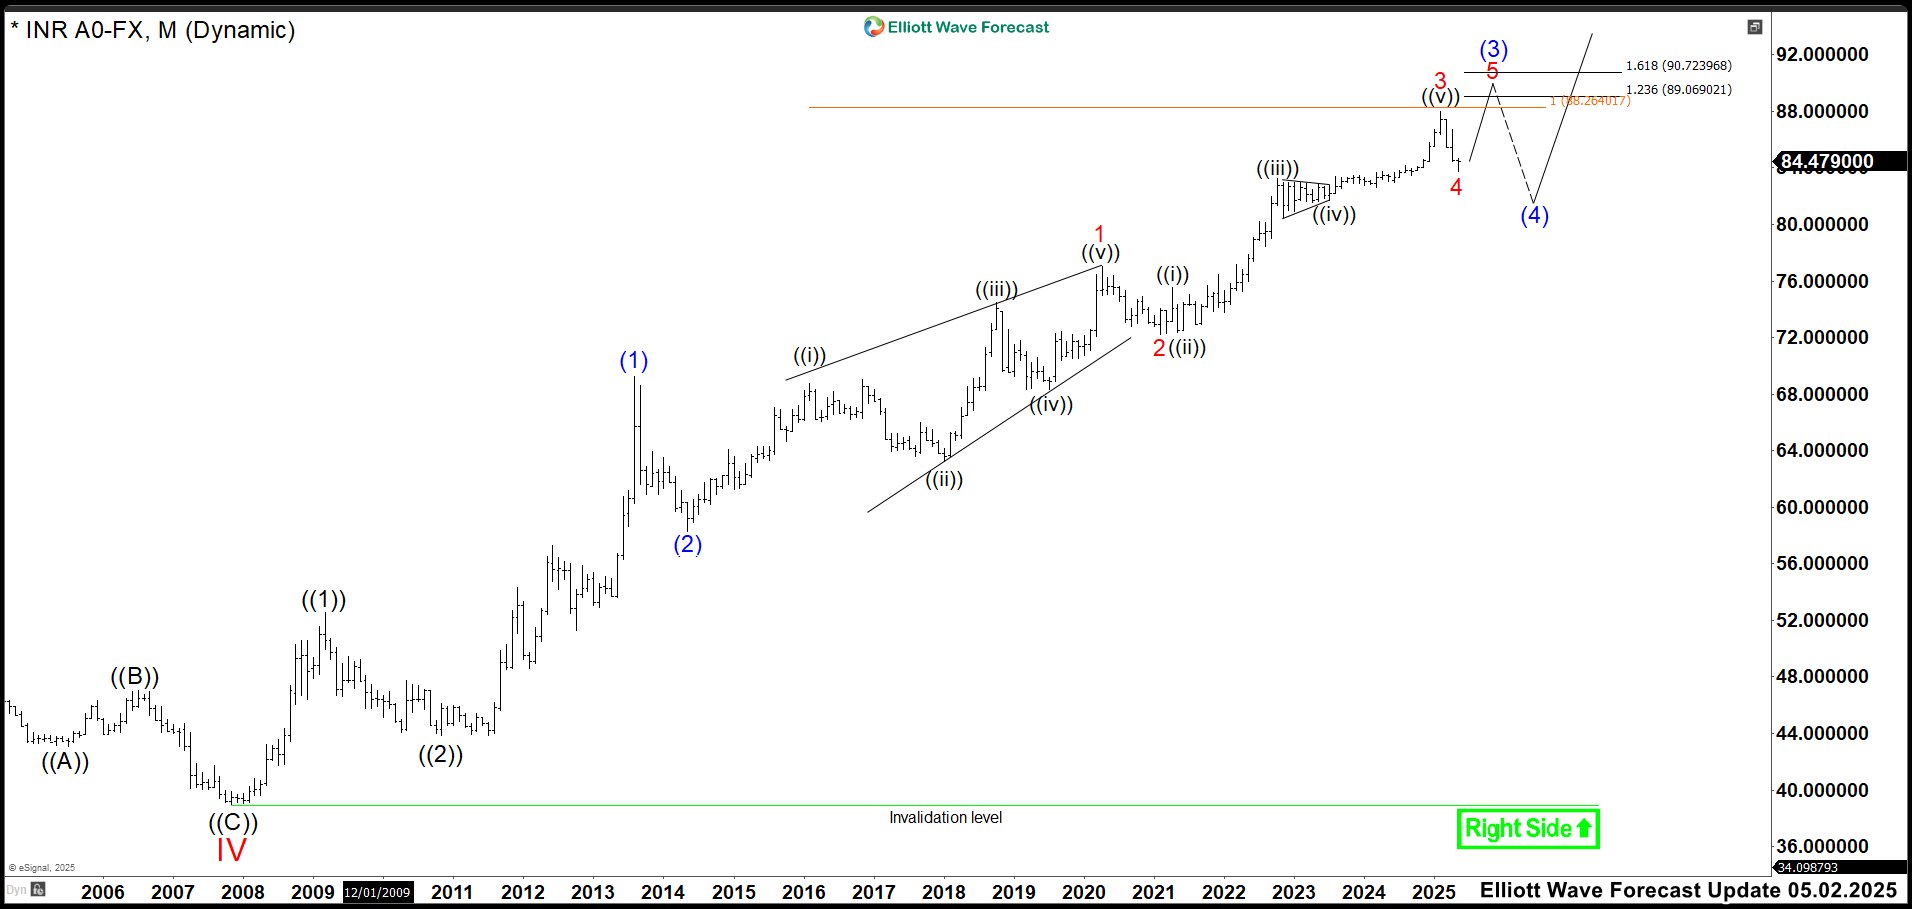
The next scenario is similar to the first, but wave 3 was already completed at 87.97, and wave 4 ended at 83.76. Therefore, the market is expected to rise toward 89.06 – 90.72 to finish wave (3) and begin wave (4) if no extensions occur. However, the key difference lies in wave (4)’s correction, which should be deeper and test the 2022-2023 triangle zone between 83.00 – 80.40. This zone should act as support, allowing the bullish momentum to continue upward.
Source: https://elliottwave-forecast.com/forex/usdinr-elliott-wave-signal-eyeing-fresh-highs/