
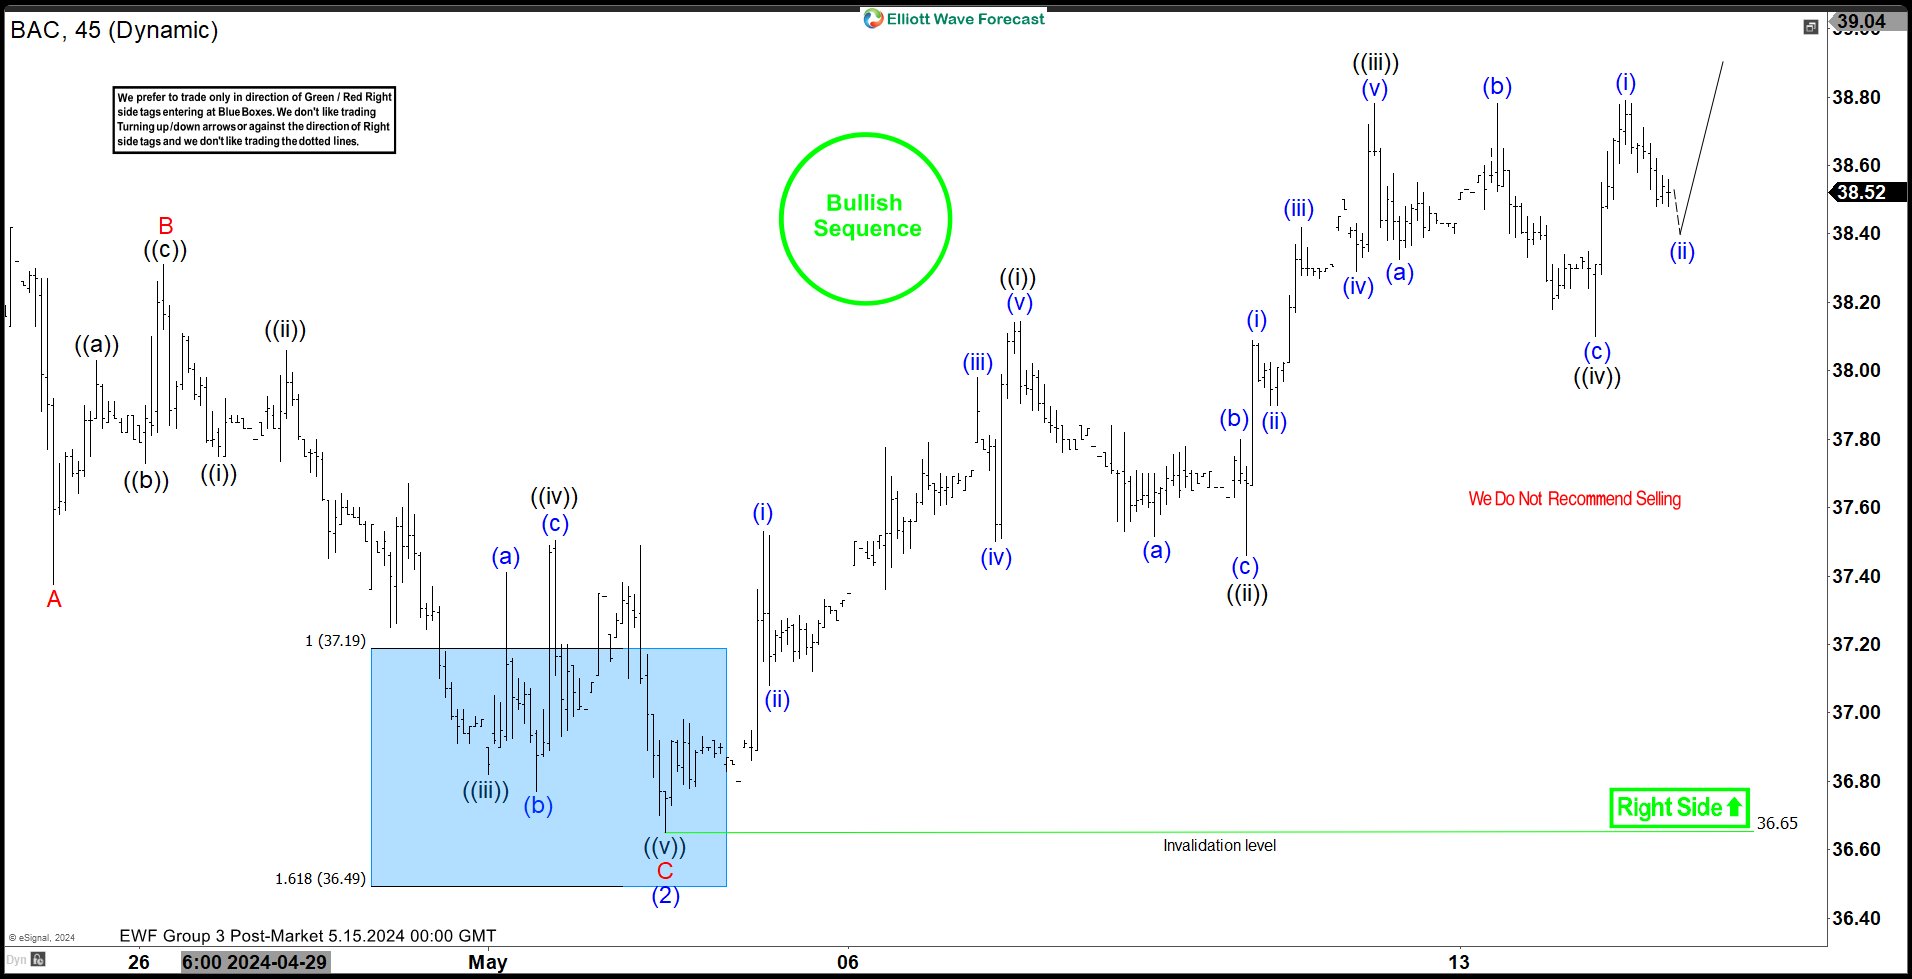
Short Term Elliott Wave in Bank of America (BAC) shows incomplete bullish sequence from 4.16.2024 low. Up from there, wave (1) ended at 38.49. Dips in wave (2) unfolded as a zigzag structure. Down from wave (1), wave A ended at 37.38 and rally in wave B ended at 38.31. The 45 minutes chart below shows the wave B as the starting point. Down from there, wave ((i)) ended at 37.75 and wave ((ii)) ended at 38.06. Wave ((iii)) lower ended at 36.82 and rally in wave ((iv)) ended at 37.51. Final leg wave ((v)) ended at 36.65 which completed wave C of (2).
The stock has turned higher in wave (3). Up from wave (2), wave ((i)) ended at 38.15 and pullback in wave ((ii)) ended at 37.46. The stock extended higher in wave ((iii)) towards 38.78 and dips in wave ((iv)) ended at 38.10. Up from there, wave (i) ended at 38.79. Expect pullback in wave (ii) of ((v)) before stock turns higher again in wave (iii) of ((v)). Near term, as far as pivot at 36.65 low stays intact, expect pullback to find support in 3, 7, 11 swing for further upside.
BAC 45 Minutes Elliott Wave Chart
Source: https://elliottwave-forecast.com/news/elliott-wave-expects-bank-america-bac-continue-higher/