
AT&T Inc. (T) is an American multinational telecommunications holding company headquartered in Dallas, Texas. It is the world’s largest telecommunications company by revenue and the third-largest provider of mobile telephone services in the U.S.
AT&T (T) Monthly Chart April 2024
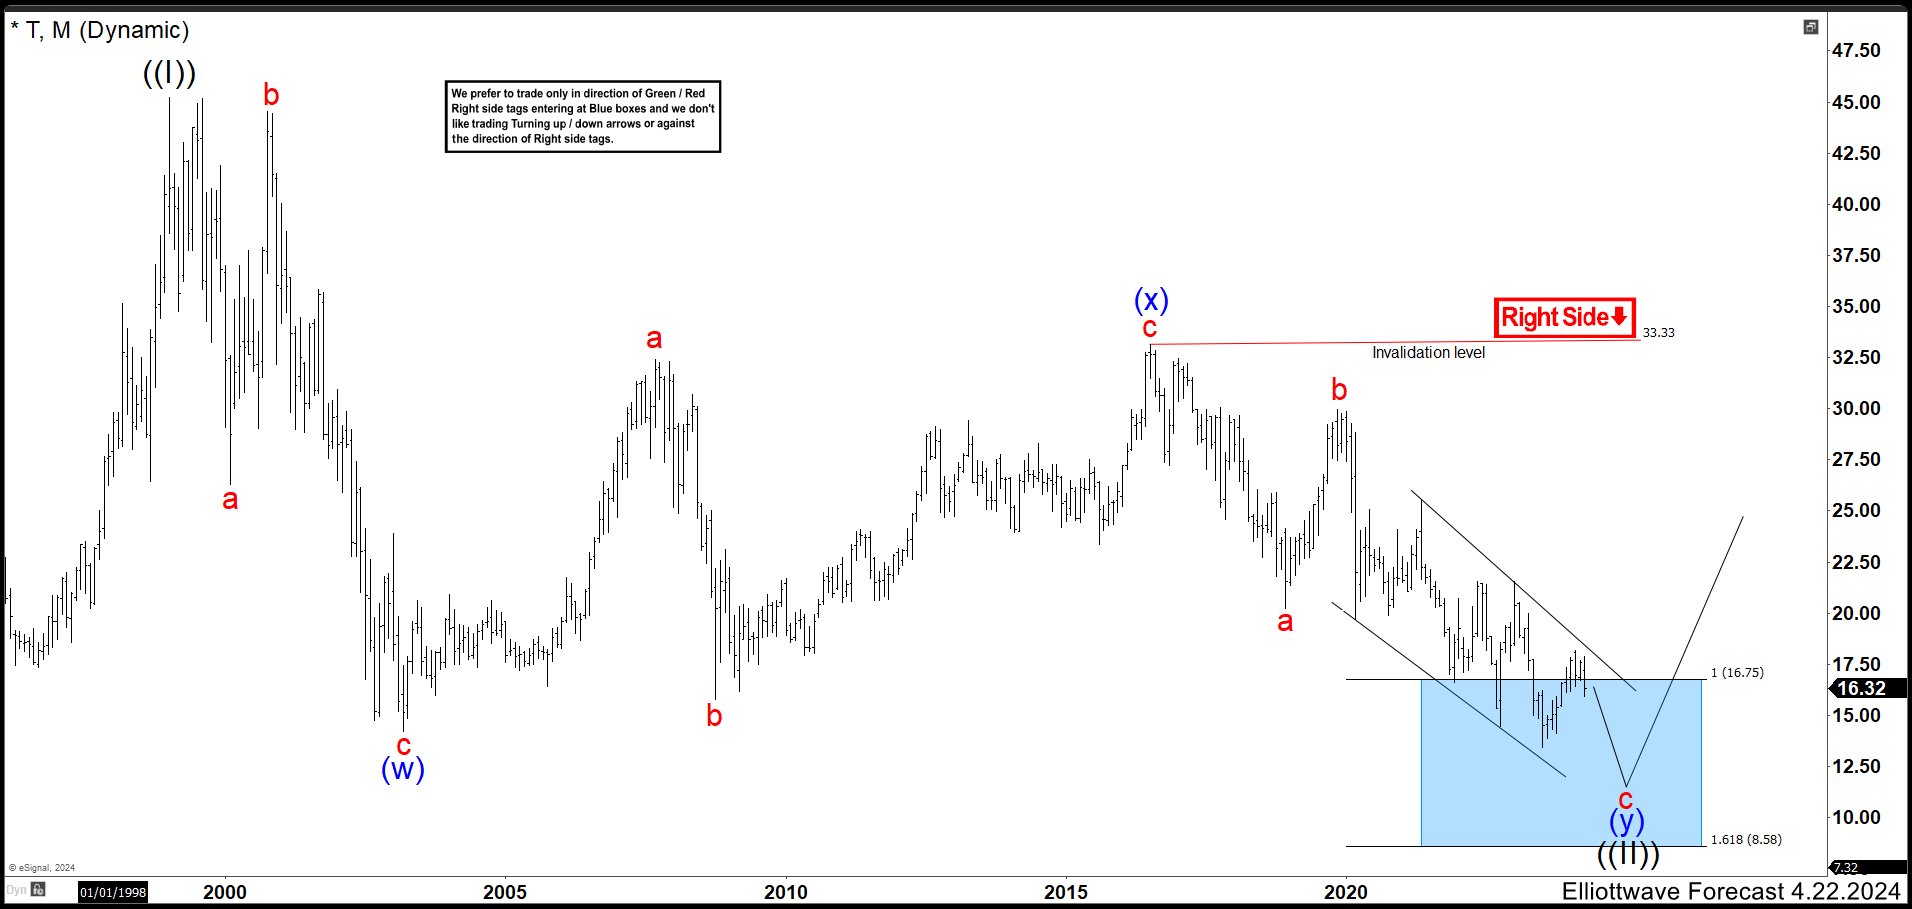
In the monthly chart above, we can see that AT&T shares finished an all-time high with a price of $45.23. Since the beginning of 1999, the value has held a downtrend and we are looking to end this correction. Using the Elliott Wave Principle, a double correction structure (w), (x) and (y) can be clearly seen. From the peak, we have 3 waves in a flat structure that ends wave (w) at $14.17 low. Then we have another flat structure that built a wave (x) ending in the value of $33.33 high.
The last leg of the double correction is the wave (y). We have already completed wave a and b, and we are developing wave c as an ending diagonal structure. The market has already reached the blue box in the $8.58 – $16.75 area, but with the current market conditions and the incomplete structure, the price should drop below $13.43.
AT&T (T) Weekly Chart April 2023
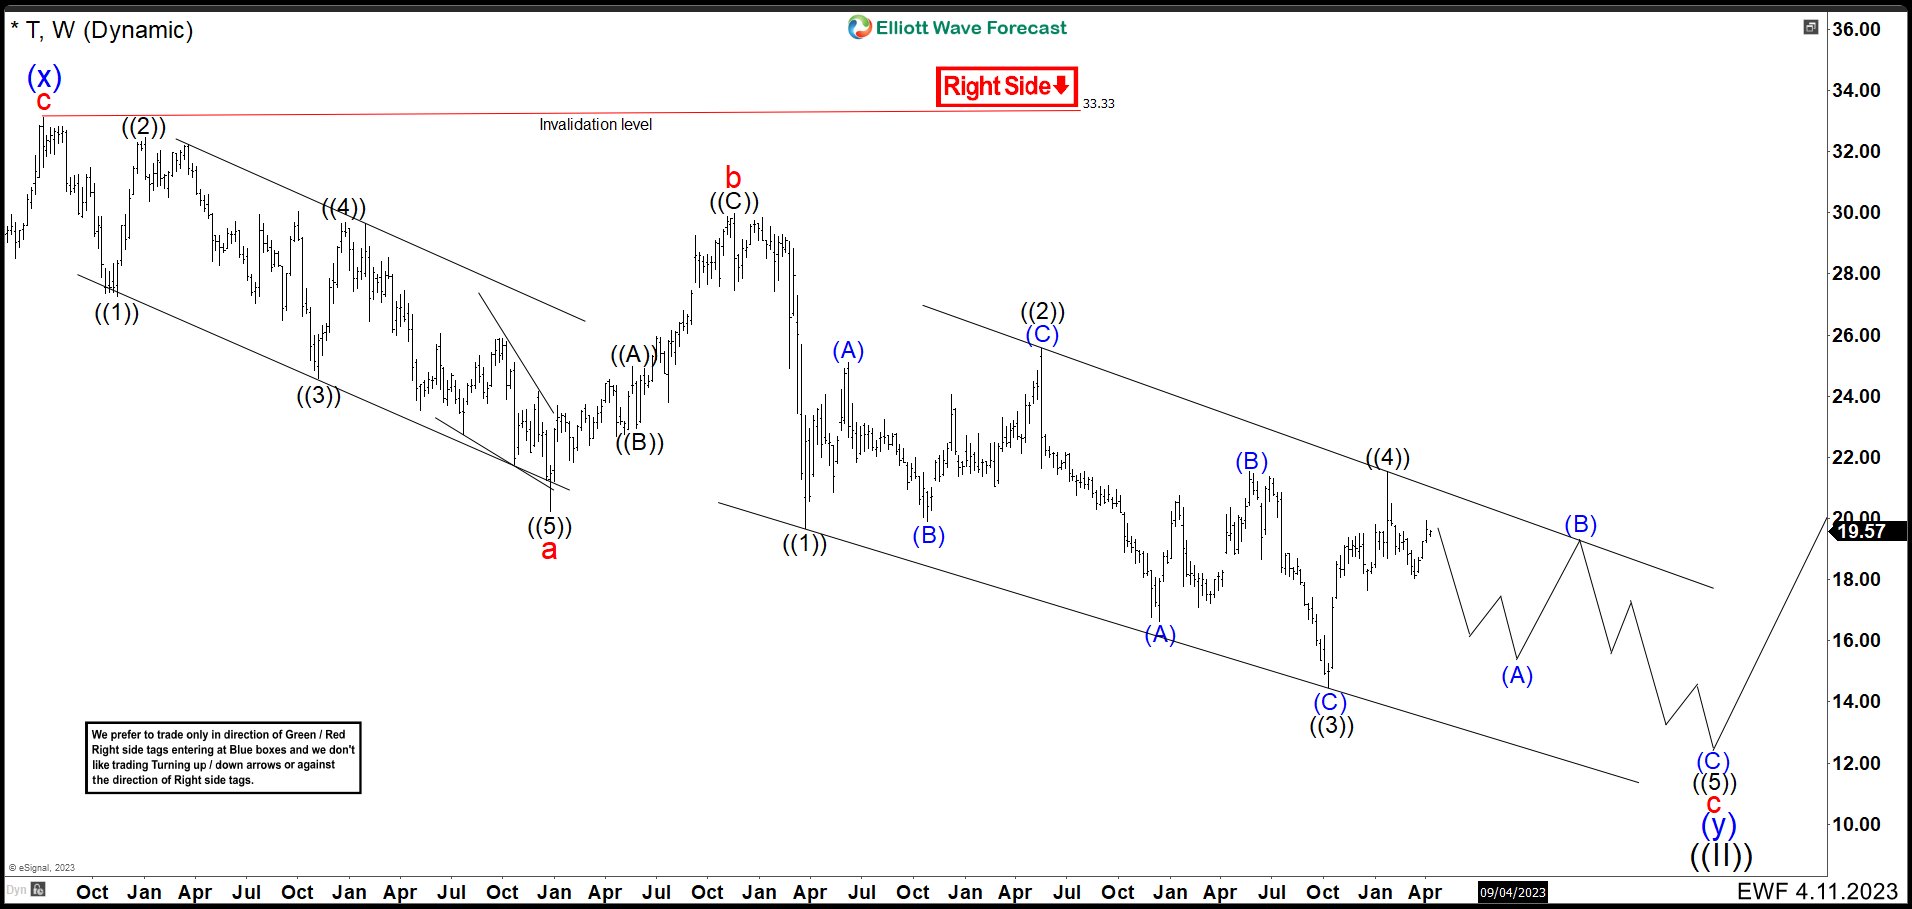
On the weekly chart one year ago, we can see in more detail the structure of the wave (y). Wave a in red made a leading diagonal that ended at $20.21 low. Then it bounced in 3 waves ending wave b at $29.96 high to continue sharply lower. Wave c has taken the form of an ending diagonal and it needed 3 more waves lower that break the price of $14.17 to confirm the structure.
AT&T (T) Weekly Chart April 2024
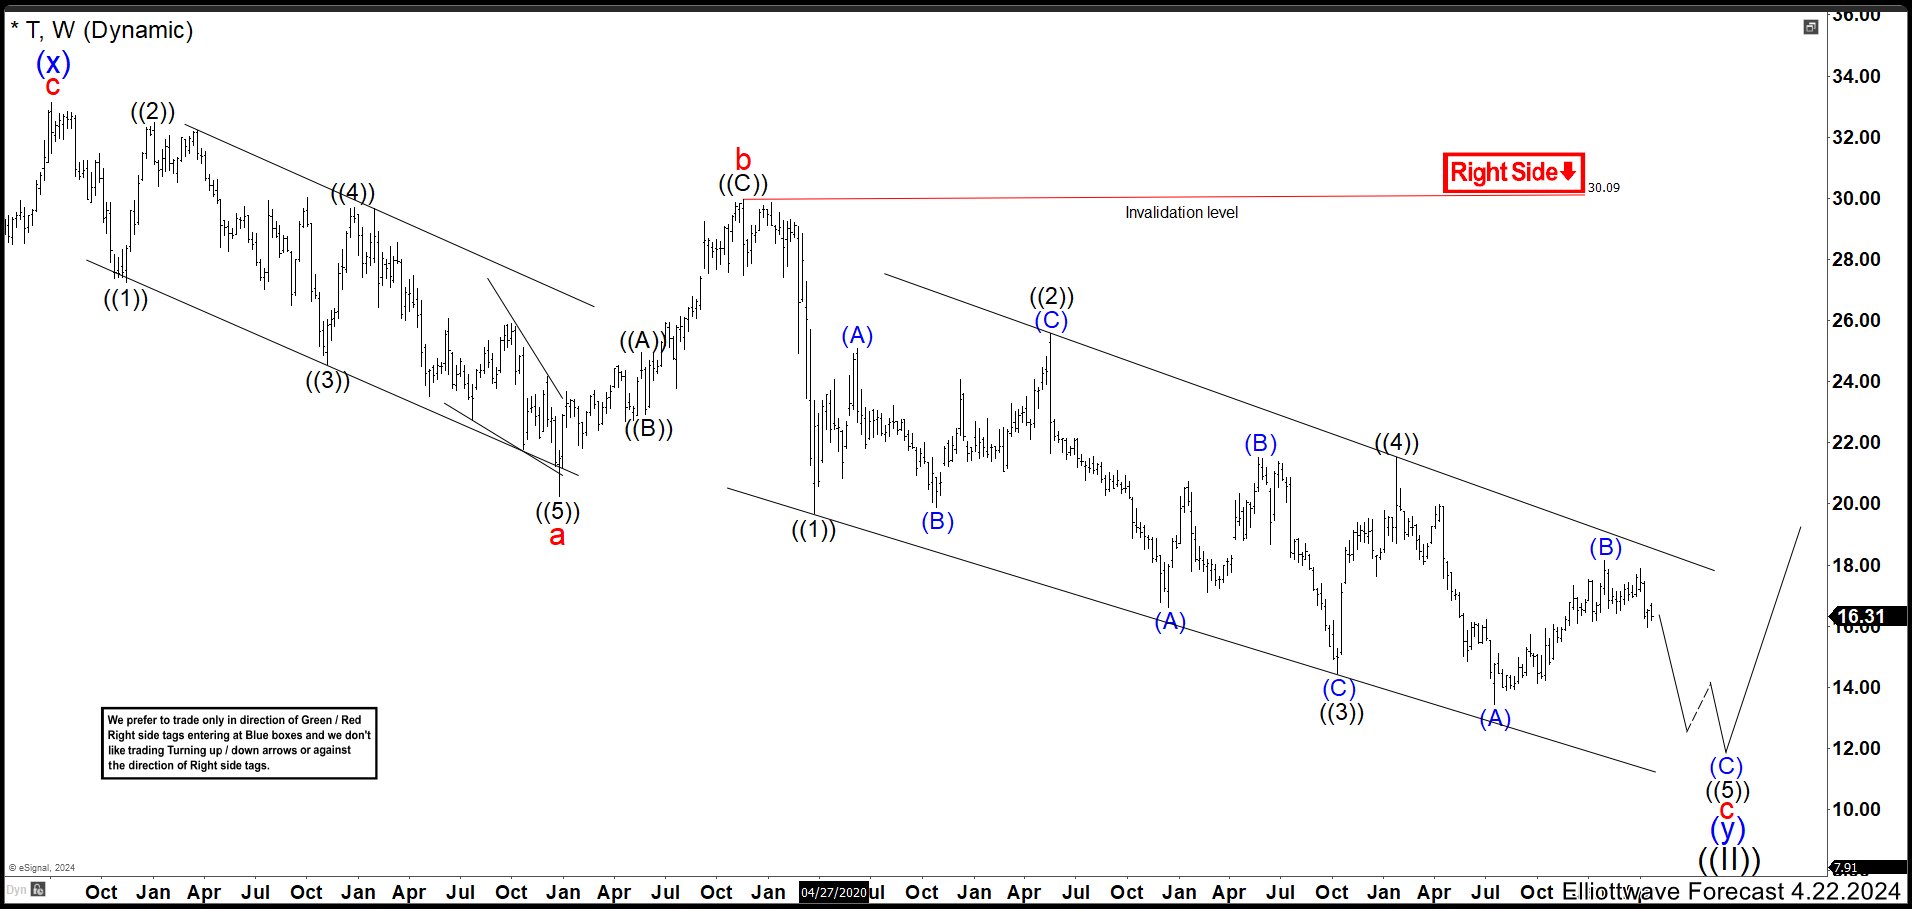
After a year, T continued lower as expected breaking $14.17 low. This drop completed wave (A) at $13.43 low. The next rally ended wave (B) at $18.16 high and it should continue to the downside breaking $13.43 low to confirm the current view. Therefore, the ending diagonal as wave c should finsih around $10.00 and the whole correction of wave ((II). In this place, the market should . If market develops another structure and remain moving to the downside, T could go down to the chilling value of $2.00.
Source: https://elliottwave-forecast.com/stock-market/elliott-wave-suggests-t-last-leg-started/