
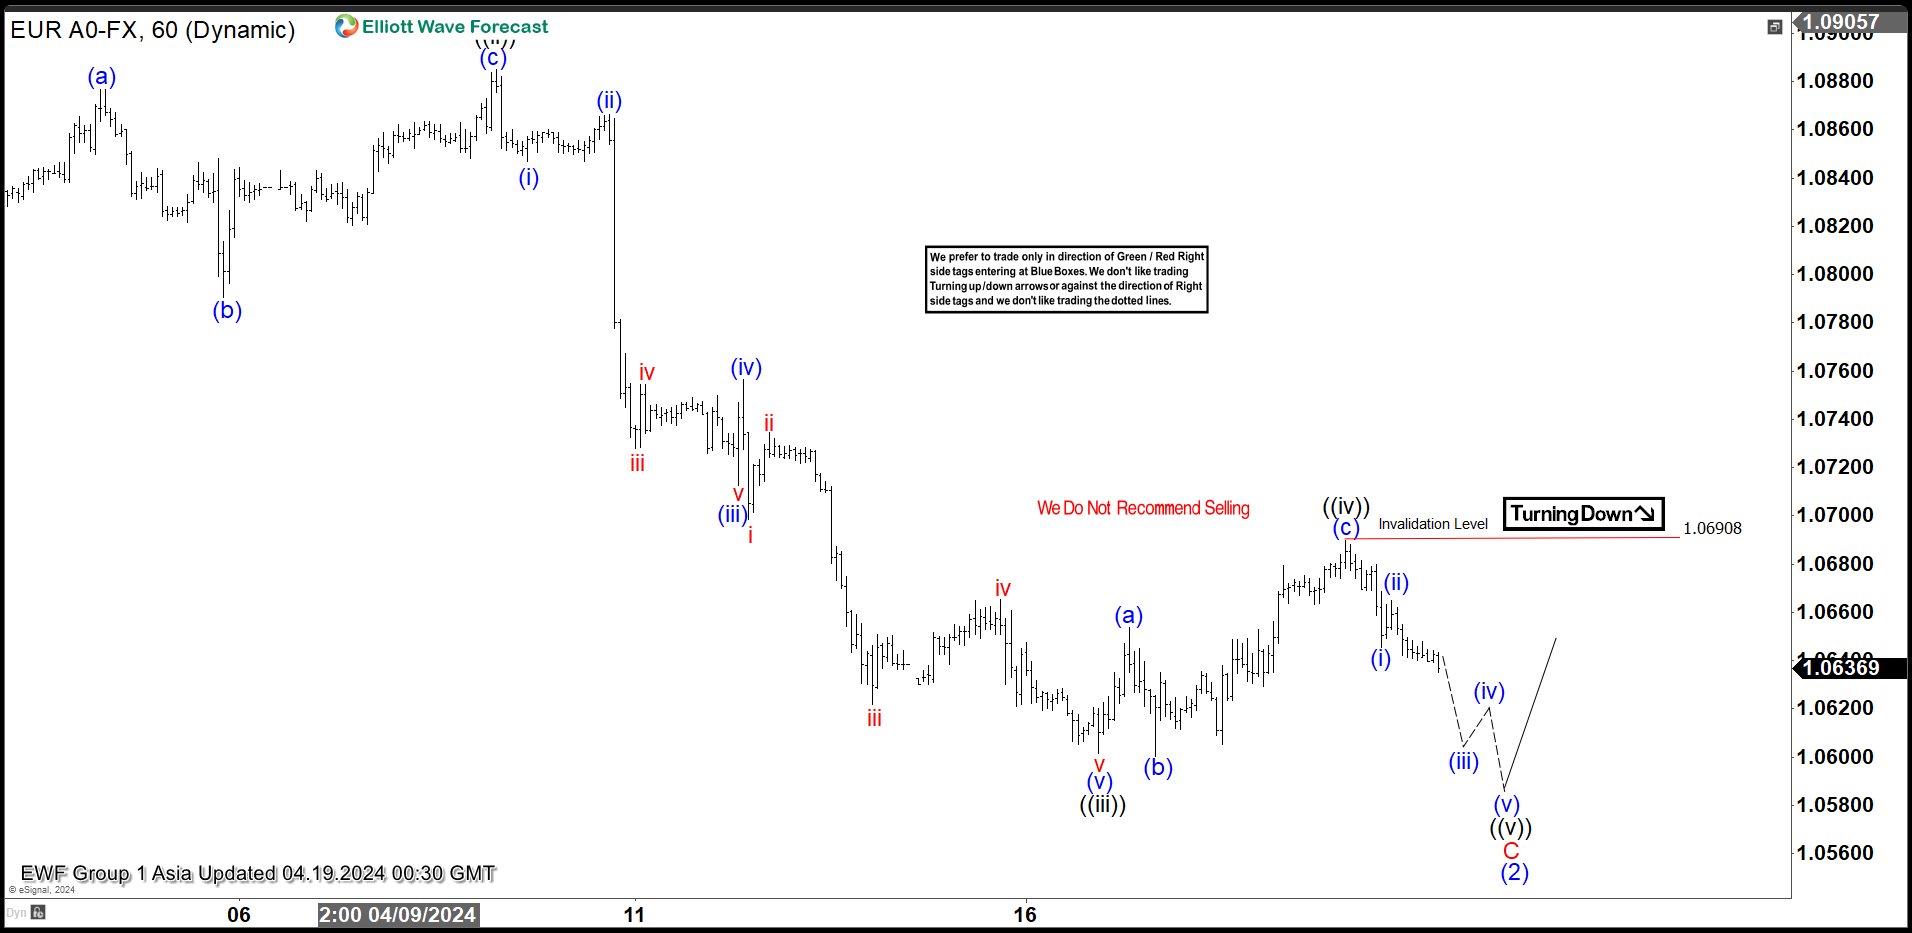
Short term Elliott Wave view in EURUSD suggests that cycle from 12.28.2023 high is in progress as a zigzag Elliott Wave structure. Down from 12.28.2023 high, wave A ended at 1.0694 and rally in wave B ended at 1.098. Wave C lower is in progress as a 5 waves impulse Elliott Wave structure. Down from wave B, wave ((i)) ended at 1.072 and rally in wave ((ii)) ended at 1.0885. Pair extends lower in wave ((iii)) with internal subdivision as another 5 waves in lesser degree. Down from wave ((ii)), wave (i) ended at 1.0846 and wave (ii) ended at 1.0866.
Wave (iii) lower ended at 1.071 and rally in wave (iv) ended at 1.0756. Final wave (v) lower ended at 1.06 which completed wave ((iii)). Wave ((iv)) rally is unfolding as an expanded Flat structure. Up from wave ((iii)), wave (a) ended at 1.065 and dips in wave (b) ended at 1.06. Wave (c) higher ended at 1.069 which completed wave ((iv)). Pair then extends lower again in wave ((v)). While below 1.069, expect pair to extend lower in wave ((v)) to complete wave C of (2) before pair turns higher.
EURUSD 60 Minutes Elliott Wave Chart
Source: https://elliottwave-forecast.com/news/forecast-elliott-wave-technique-calling-eurusd-extend-lower/