
Texas Instruments Incorporated (TXN) is a well-established American technology company headquartered in Dallas, Texas. It’s known primarily for its semiconductor and integrated circuit products, which are used in a wide range of applications including industrial, automotive, consumer electronics, and telecommunications. In this post, we will look at the TXN Elliott Wave Analysis.
TXN Elliott Wave – Monthly Chart April 2024
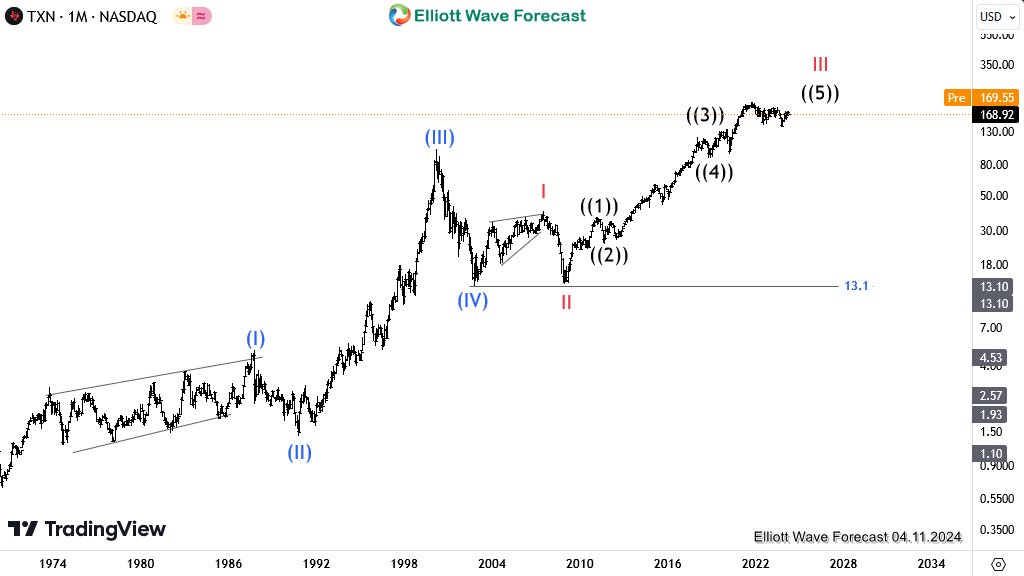
TXN has been one of the most profitable stocks in the past decades, with a growth of over 745% in the last 20 years. We believe this bullish trend will continue as the impulse cycle that started before the 70s has yet to end. As the monthly chart shows, the stock completed the 4th wave – wave (IV) of the super cycle degree in October 2022. Since that time, the 5th wave – wave (V) has been evolving into an impulse as well. Currently, we seem to be in wave ((5)) of III of (V). Given this exposition, there is a high likelihood that prices will continue to rise in the coming years. So, the buyers are in control and it’s only logical to play along with the direction of the trend until it breaks. At the moment, the trend is not yet exhausted.
TXN Elliott Wave – Weekly Chart April 2024
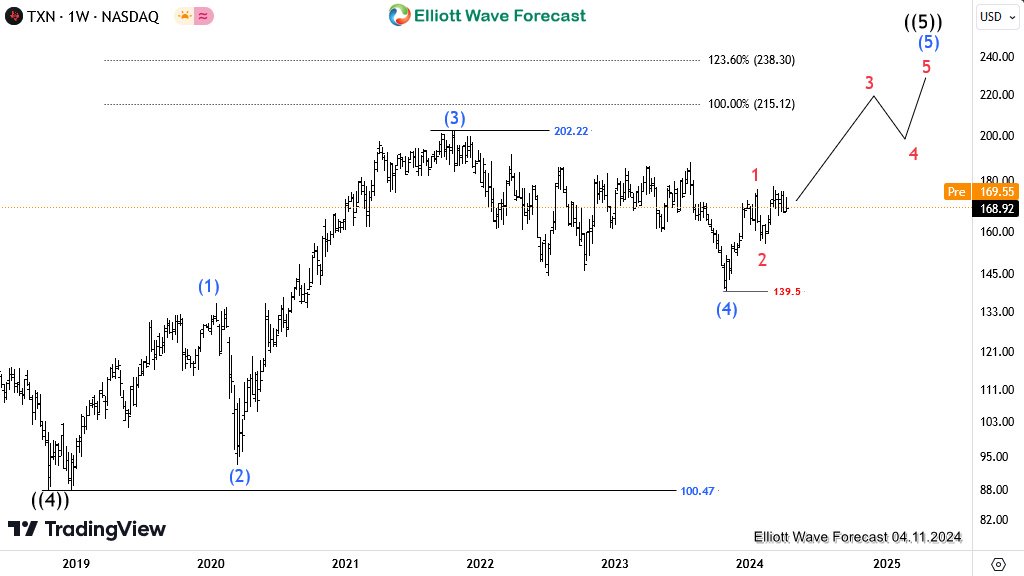
On the weekly time frame, we will focus on how wave ((5)) has been developing since it started in December 2018 at 87.7. Wave (4) of ((5)) ended at 139.5 in October 2023 after completing a double zigzag pattern. The impulse rally that followed the end of (4) suggests that we can anticipate wave ((5)) to break above the 202.22 high into the 215.12-238.30 Fibonacci projection zone of wave (1) from (4). Looking past wave (4), the price seems to have completed waves 1 and 2 of (5) of ((5)). So we are currently in wave 3 of (5) of ((5)) after the price broke above wave 1 high albeit marginally. Going to the lower time frame, we will take a closer look at the sub-waves of wave 3 as they develop.
TXN Elliott Wave – Daily Chart April 2024
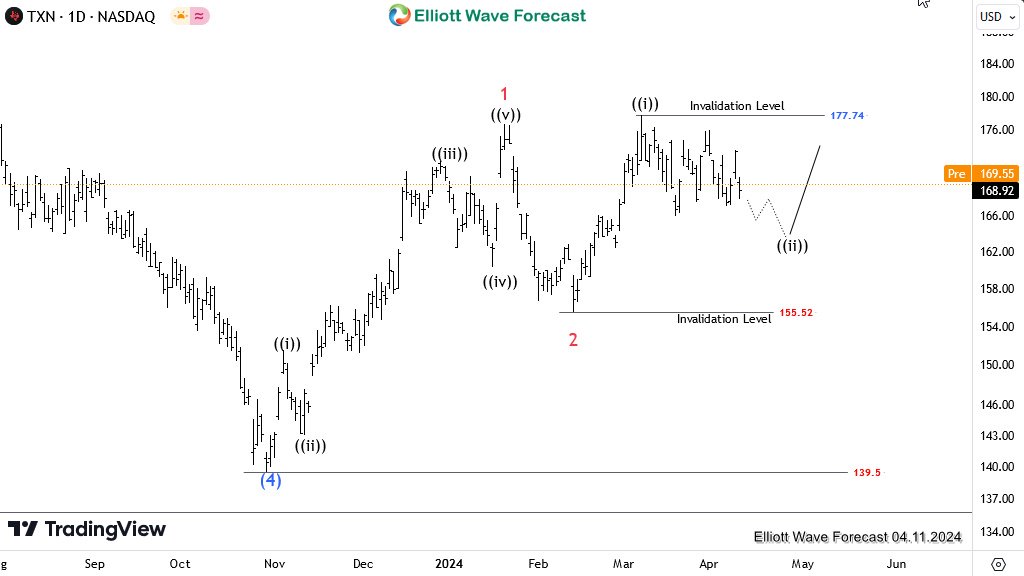
On the daily time frame, we are currently in wave ((ii)) of 3, which is currently experiencing a pullback following wave ((i)) peak at 177.74. Wave ((iii)) is now expected to break above 177.74 provided a dip below wave 2 low at 155.52 doesn’t happen. If that occurs, we may be experiencing a sort of flat pattern for 2 lower than 155.52. However, the current wave count is of much higher probability, thus our preference. The intention will be to buy the wave ((ii)) pullback at the extreme in anticipation of wave ((iii)) higher.
TXN Elliott Wave – H4 Chart April 2024
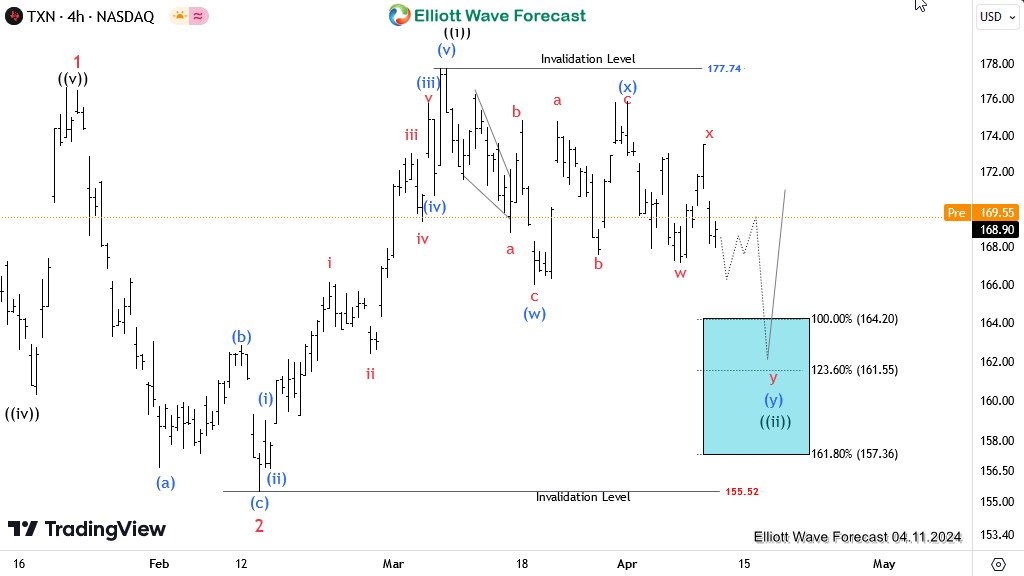
On the 4H time frame, the pullback for ((ii)) is completing a double zigzag (7-swing) pattern that can extend to the extreme of 164.2-to-157.36 where buyers should be waiting to buy again. In a bullish sequence, the best bet is to buy dips in 3, 7, or 11 swings.
TXN Elliott Wave – H1 Chart April 2024
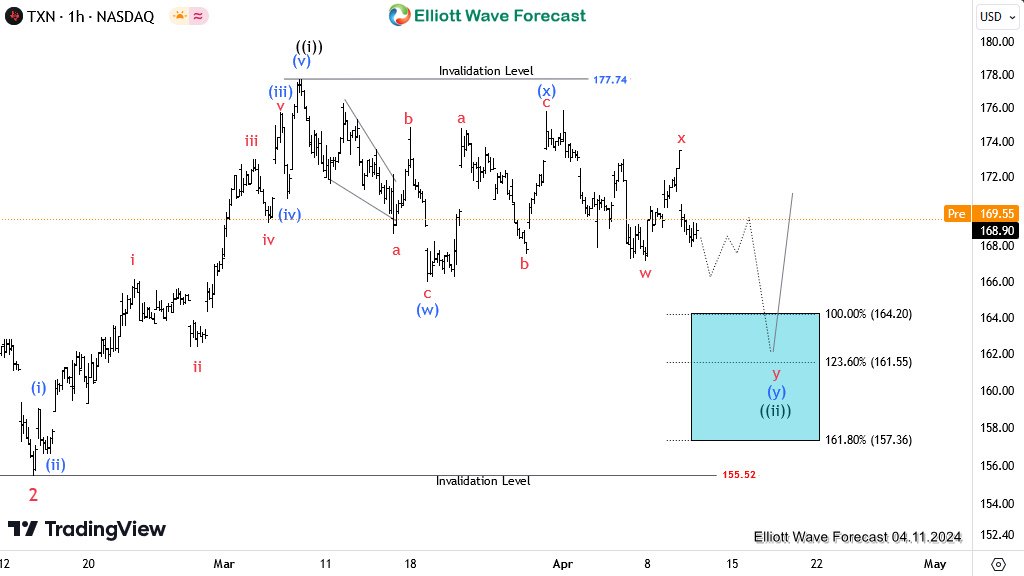
The 1hr time frame above shows the sub-waves of the 7-swing better with invalidation at 155.52. Traders can look at buying opportunities in the zone to join the next impulse – wave ((iii)) – above 177.74 toward 197.2. If a bounce happens off the zone, the least we could get is another 3-wave bounce that could lead to a lower wave 2 in case of an invalidation below 155.2. We need to understand the alternative view as well even if it’s less likely.
Source: https://elliottwave-forecast.com/stock-market/txn-elliott-wave-buy-pullback/