URA is a Uranium ETF that tracks the performance of companies involved in the uranium industry globally. It provides investors with diversified exposure to uranium mining, exploration, and production companies, offering a convenient way to invest in this sector. Below we will take a look at the Elliott Wave outlook for the ETF.
$URA Elliott Wave Chart Monthly Chart
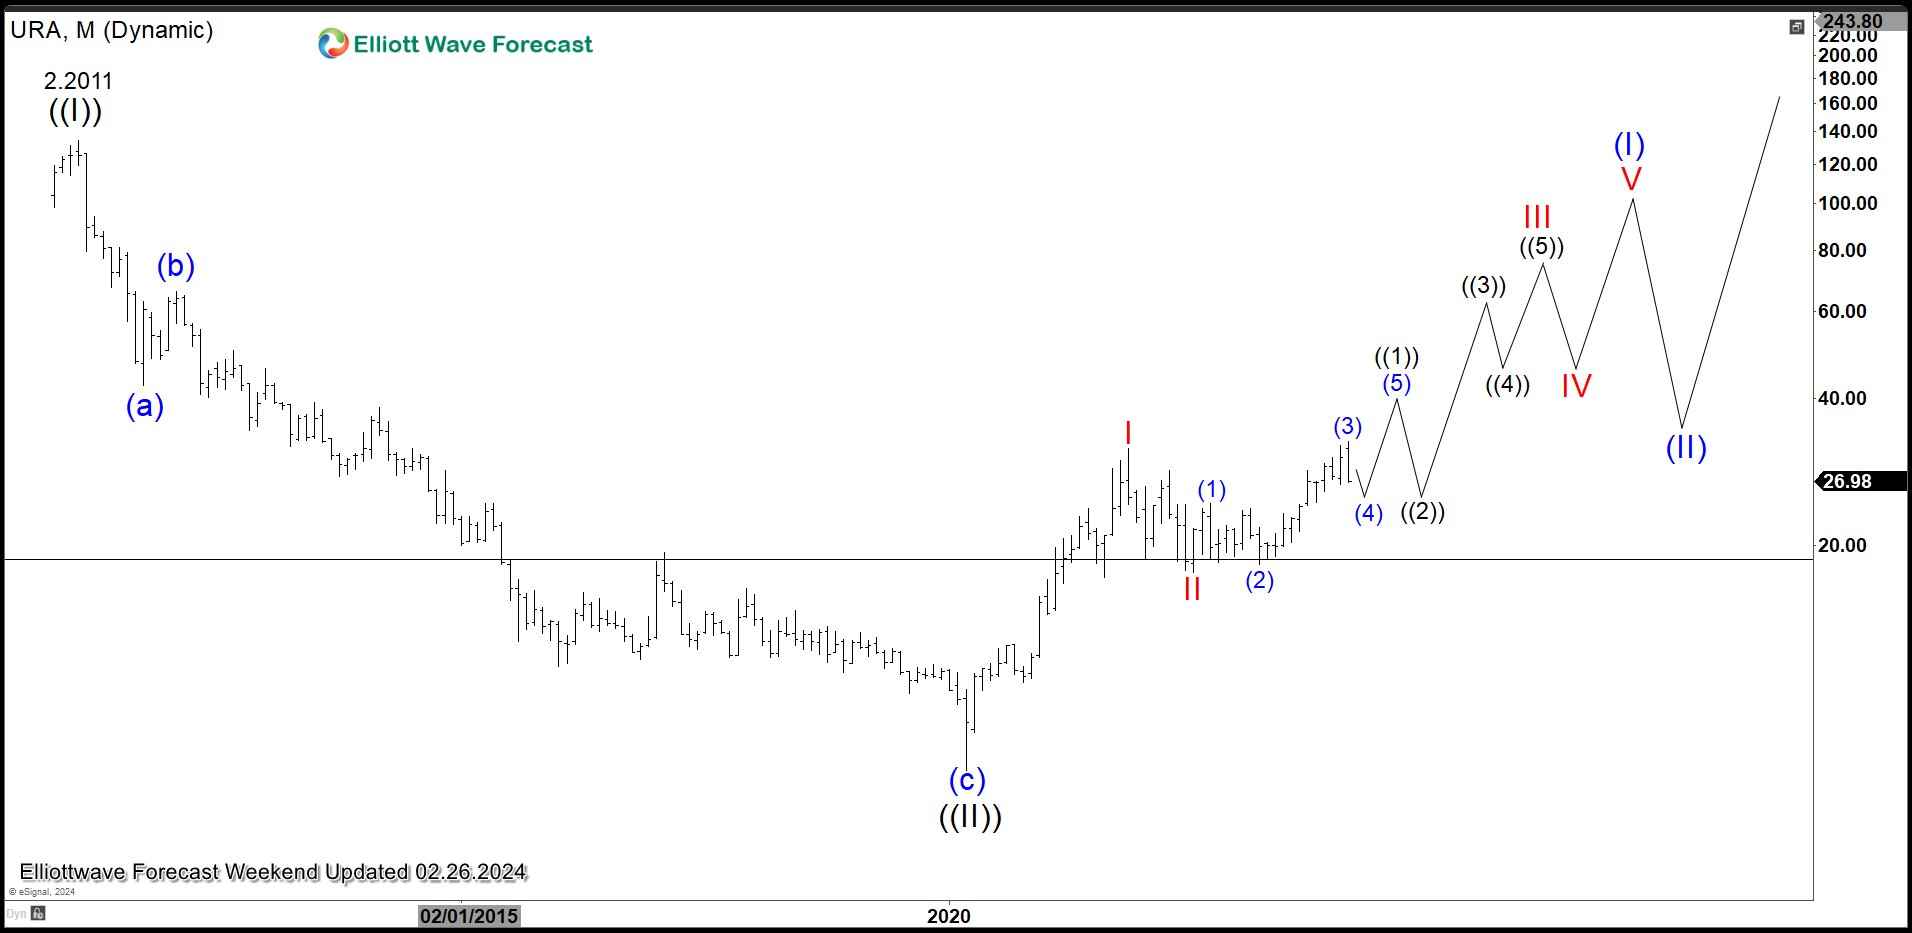
Monthly Elliott Wave Chart of Uranium ETF (ETF) above shows that the ETF ended wave ((II)) at 6.95. The ETF then starts a new bullish cycle in wave ((III)). Up from wave ((II)), wave I ended at 31.60 and pullback in wave II ended at 17.65. The ETF has now extended higher in wave III. Above wave II, wave (1) ended at 24.34 and dips in wave (2) ended at 18.31. Up form there, wave (3) ended at 32.60. Expect pullback in wave (4) followed by wave (5) higher to end wave ((1)) in higher degree. Afterwards, it should pullback in wave ((2)) in 3, 7, 11 swing before it resumes higher.
$URA Daily Elliott Wave Chart
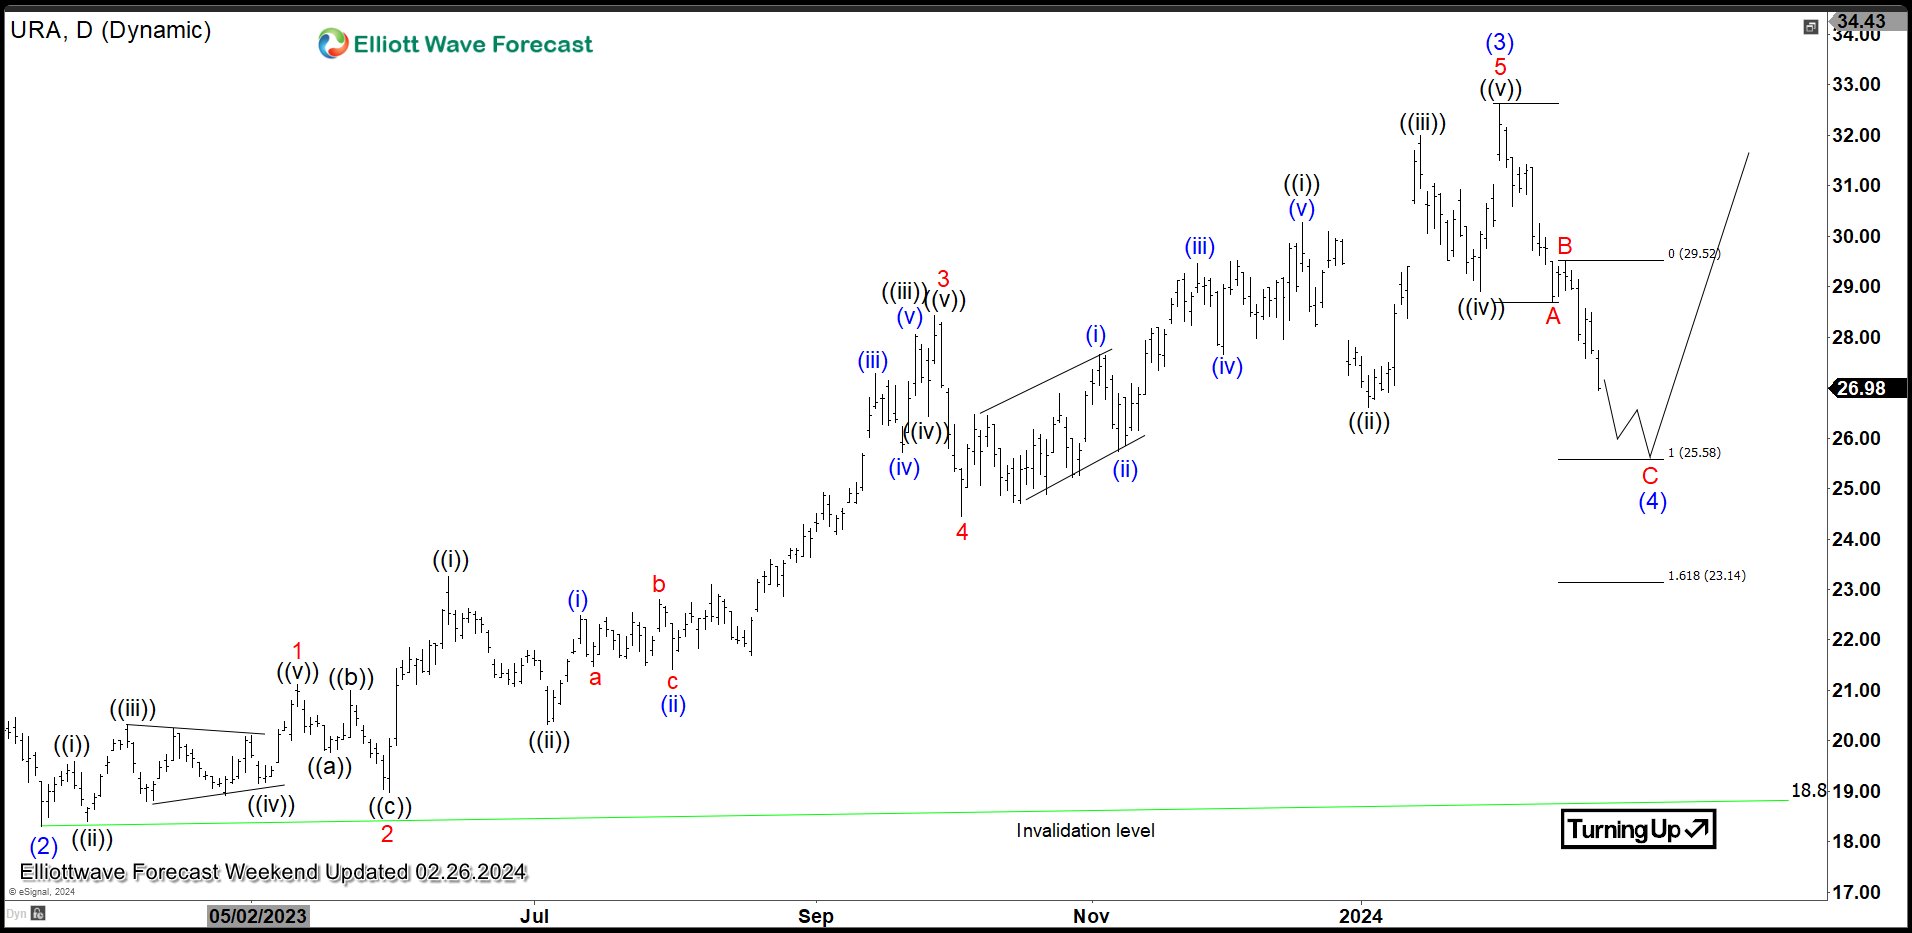
In Daily Elliott Wave Chart of $URA above, the ETF has ended wave (2) at 18.33 and extended higher in wave (3). Up from wave (2), wave 1 ended at 21.12 and pullback in wave 2 ended at 18.97. The ETF extended higher in wave 3 towards 28.42 and dip sin wave 4 ended at 24.45. Final leg wave 5 ended at 32.60 which completed wave (3). Pullback in wave (4) is in progress and can reach 23.1 – 25.5 area before finding buyers.
Source: https://elliottwave-forecast.com/news/uranium-etf-ura-correction-progress/