Visa Inc (NYSE: V) is an American multinational payment card services corporation headquartered in San Francisco, California. It facilitates electronic funds transfers throughout the world, most commonly through Visa-branded credit cards, debit cards and prepaid cards. This article dives into the potential technical trajectories within its weekly cycle using Elliott Wave Theory.
In November 2023, Visa stock surged into new all time highs after breaking above 2021 peak. The move created a weekly bullish sequence and it will be looking for a higher target at least toward equal legs area $425 – $581.
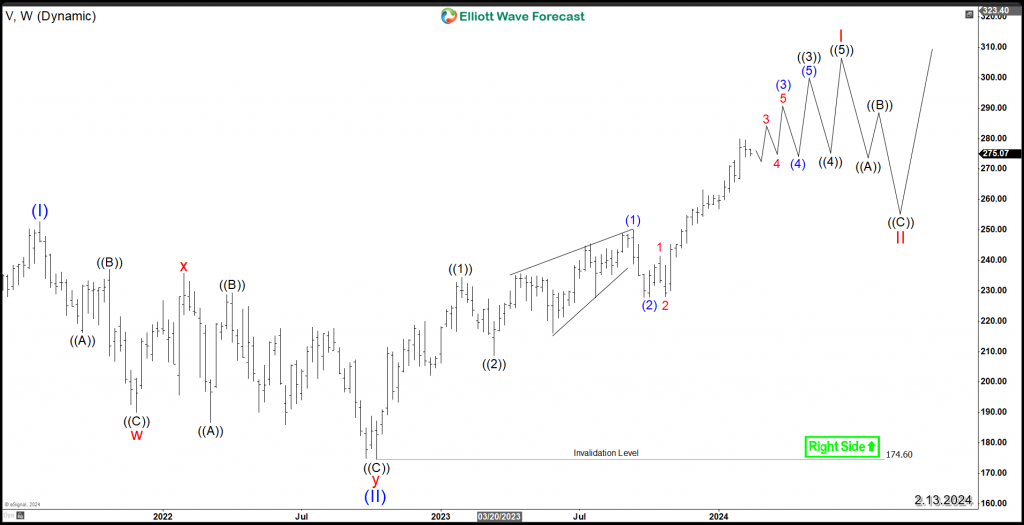
The Initial rally from October 2022 low is proposed to unfold as a bullish nest within wave I of (III). The rally within the 3rd wave usually has the strongest momentum within a regular impulse. The price action is more supported to the upside while pullbacks are short-lived because buyers will keep entering the market after 3 , 7 or 11 swings as long as the trend stays intact.
The stock will continue the rally within a series of 4th & 5th waves until it finish the 5 waves advance within wave I. After ending that cycle, a correction within wave II will take place presenting a potential new investment opportunity to join the weekly bullish trend as the stock is still proposed to be rallying within wave (III).
The weekly bullish sequence will support Visa in the coming years therefore investors are advised to keep an eye for the daily corrective pullbacks to be able to join then bullish trend.
V Weekly Chart 2.13.2024

Source: https://elliottwave-forecast.com/stock-market/visa-v-signals-upside/

