
GDXJ is an ETF tracking small-cap gold and precious metals mining companies. It has a focus on smaller, more volatile firms. Thus it offers exposure to this precious metal sectors, but investors should be cautious of increased risk. In this article, we will update the Elliott Wave outlook for the ETF.
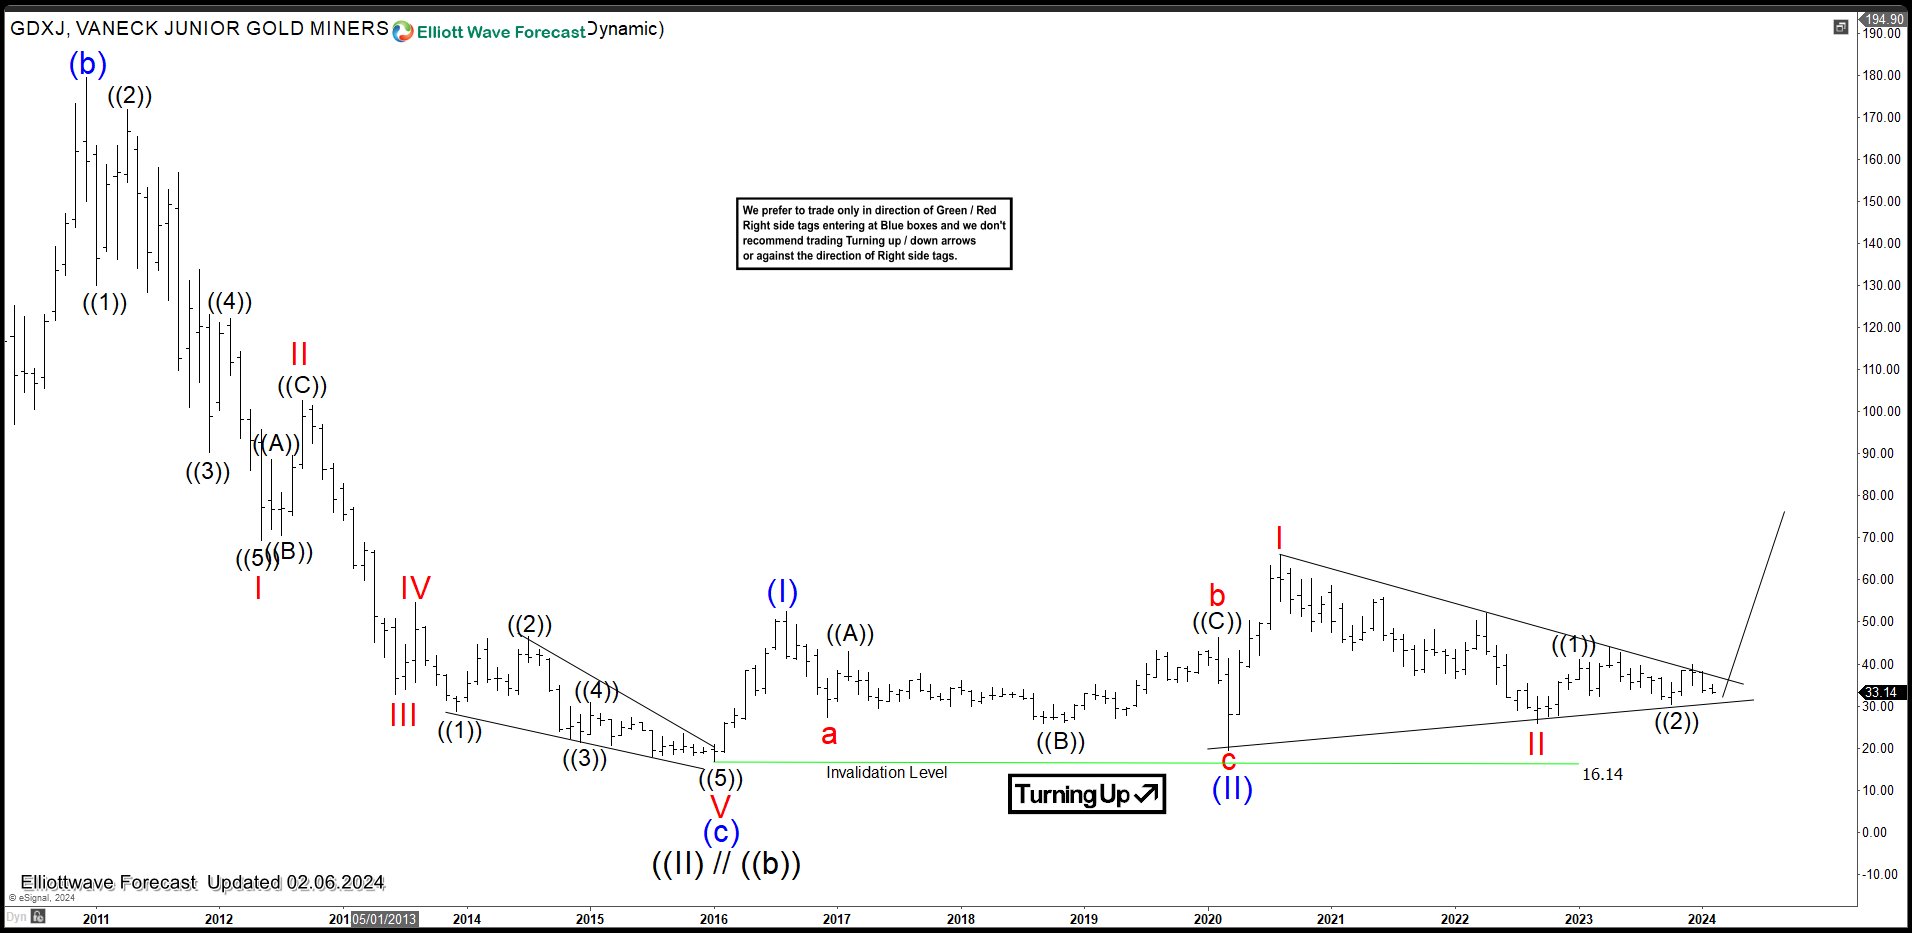
GDXJ Monthly Elliott Wave View
Monthly chart of GDXJ above suggests that the ETF ended either wave ((II)) / ((b)) at $16.14 on January 2016. Up from there, the ETF has started a rally which can be counted either as a nest or a diagonal. Above shows a nest count where wave (I) ended at 52.50 and pullback in wave (II) ended at 19.52. The ETF then rallied higher again in a nest. Up from wave (II), wave I ended at 65.95 and pullback in wave II ended at 25.8. The ETF is expected to extend higher while holding above invalidation level of $16.14.
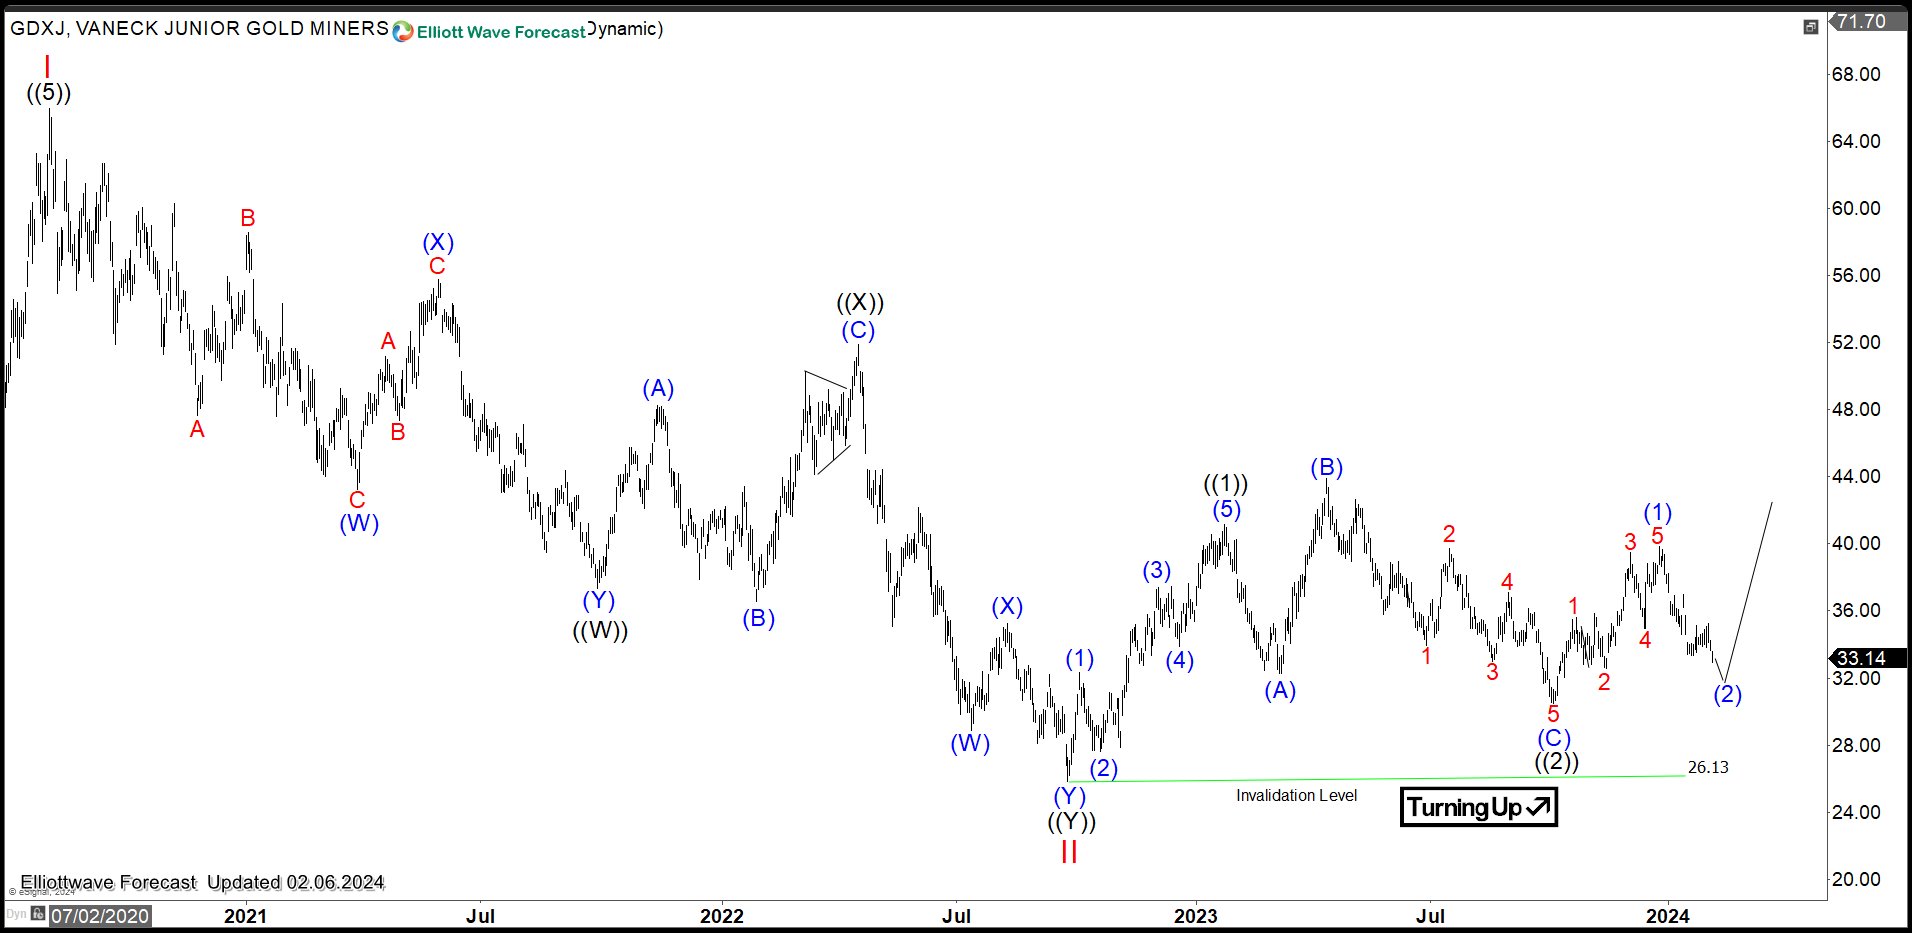
GDXJ Daily Elliott Wave View
Daily Elliott Wave Chart of GDXJ above shows the ETF ended wave II at 25.96. Wave III is in progress as an impulsive structure. Wave ((1)) of 3 ended at 41.16 and wave ((2)) of 3 ended at 30.46. The ETF then resumed higher and created a nest. Up from wave ((2)), wave (1) ended at 39.82 and wave (2) pullback remains in progress to correct cycle from 10.2.2023 low in 3 or 7 swing before it resumes higher. As far as pivot at 26.13 low stays intact, expect the ETF to extend higher.
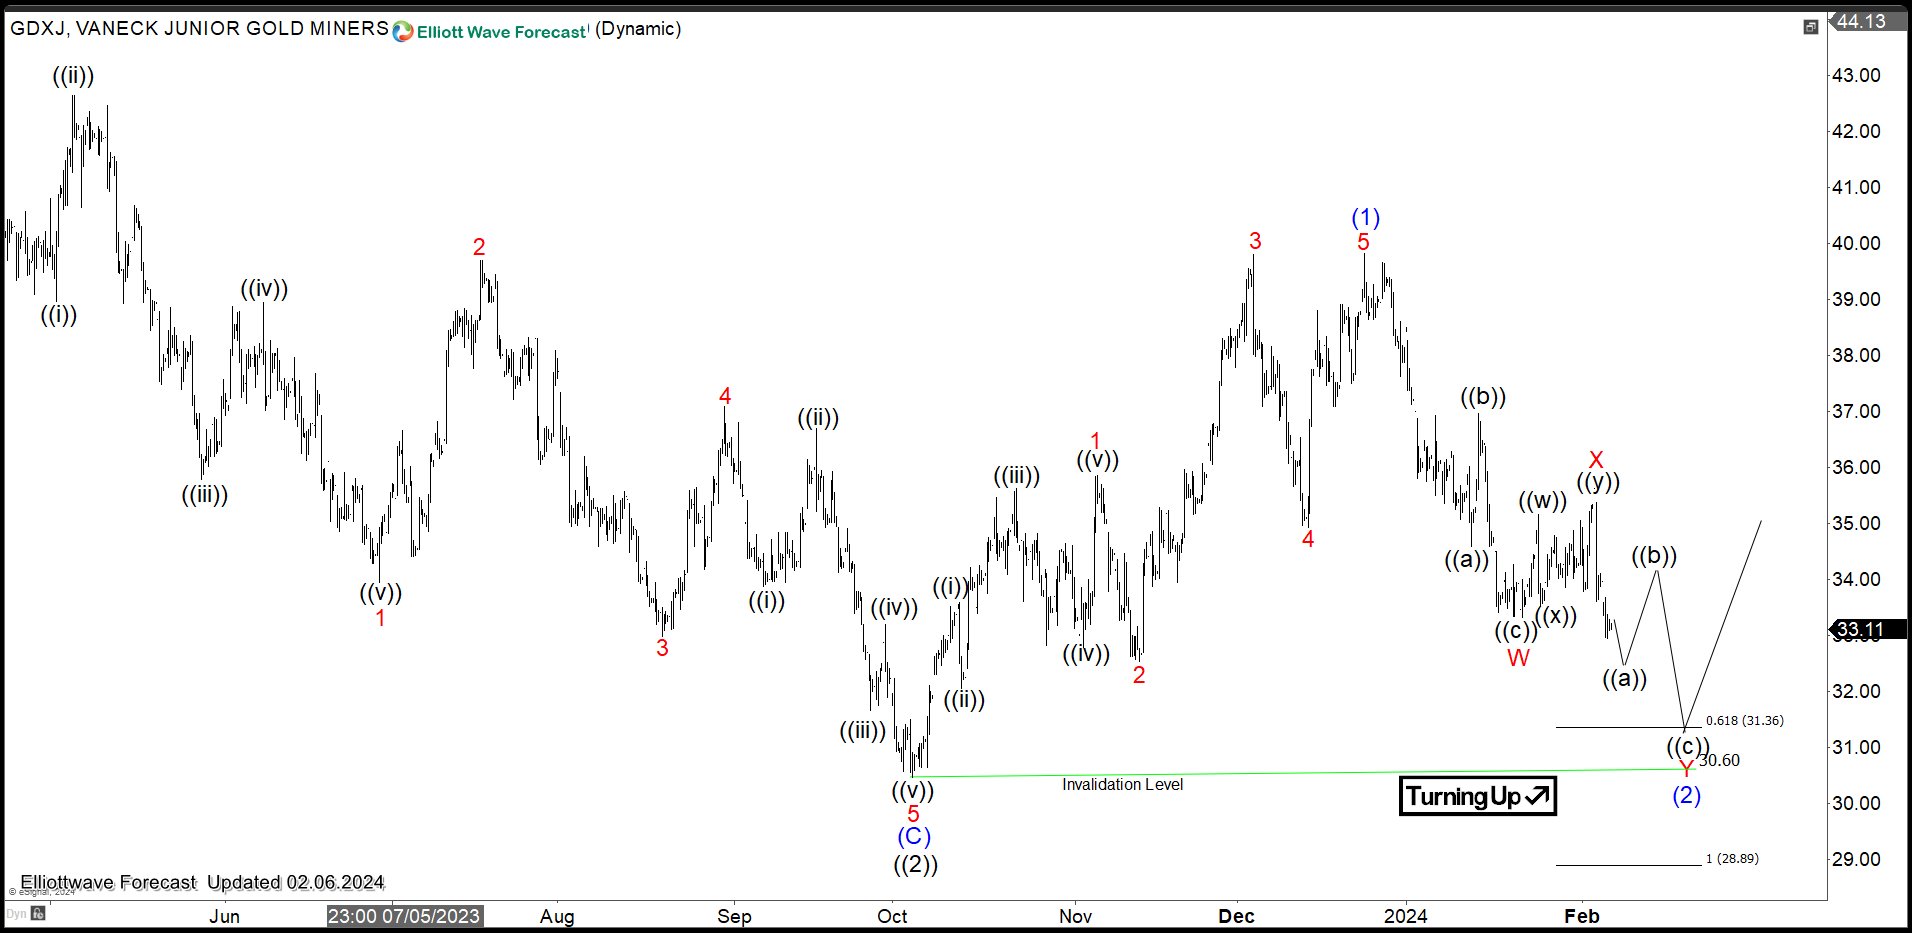
GDXJ 4 Hour Elliott Wave View
4 Hour Elliott Wave view of GDXJ above shows that wave (2) of ((3)) correction remains in progress and can still extend lower to retest wave ((2)) low at 30.6 before it resumes higher. Near term, while it stays above 30.6, expect the ETF to extend higher.
Source: https://elliottwave-forecast.com/video-blog/gdxj-searching-bottom-next-bullish-leg/