Digital World Acquisition Corporation is a blank check company formed for the purpose of effecting a merger, capital stock exchange, asset acquisition, stock purchase, reorganization or similar business combination with one or more businesses. While the company may pursue an initial business combination target in any business or industry, it intends to focus on combining with a leading tech company. In October 2021, the company announced a proposed merger agreement with Trump Media & Technology Group. Founded 2020 and headquartered in Miami, Florida, US, one can trade it under ticker $DWAC at NASDAQ.
Digital World Weekly Elliott Wave Analysis 01.29.2024
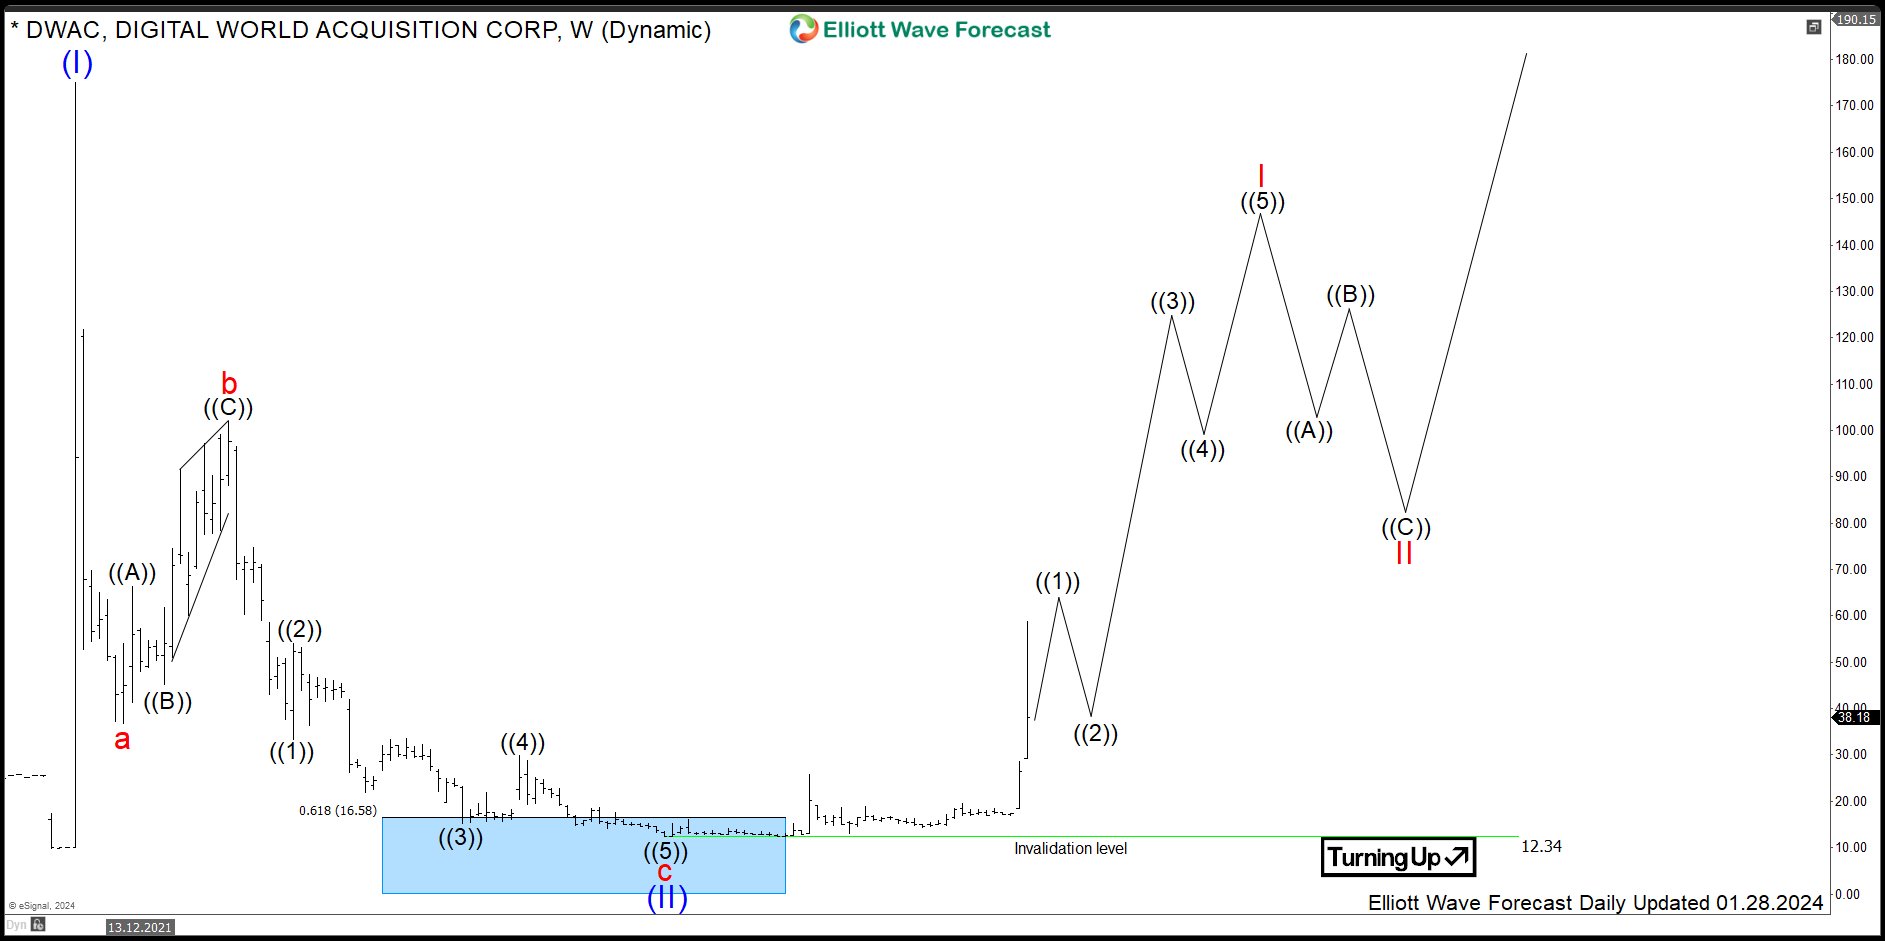
The weekly chart below shows the Digital World Acquisition Corporation shares $DWAC traded at NASDAQ. First, from the all-time lows, the stock price has developed a cycle higher in blue wave (I). Hereby, $DWAC has printed the all-time highs in October 2021 at $175. From the highs, a correction lower in wave (II) has unfolded as a zigzag pattern being a 5-3-5 structure. Firstly, red wave a has printed a low in November 2021 at $36.69. Secondly, bounce in red wave b has set a connector in February 2022. Later, from $101.87 highs, the price has broken $36.69 opening up a bearish sequence. Now, full 100% extension in red wave c would mean that the price should go into negative range. As a matter of fact, it is impossible. As a consequence, price should truncate at 0.618-0.786 extension area being $16.58-0.00 range. Indeed, $DWAC reached that area and bounced.
It is the preferred view, that blue wave (II) has ended in March 2023. While above $12.34, wave (III) has started and is in the initial stages. The target for wave (III) will be $187-296 area and even higher.
Digital World Daily Elliott Wave Analysis 01.29.2024
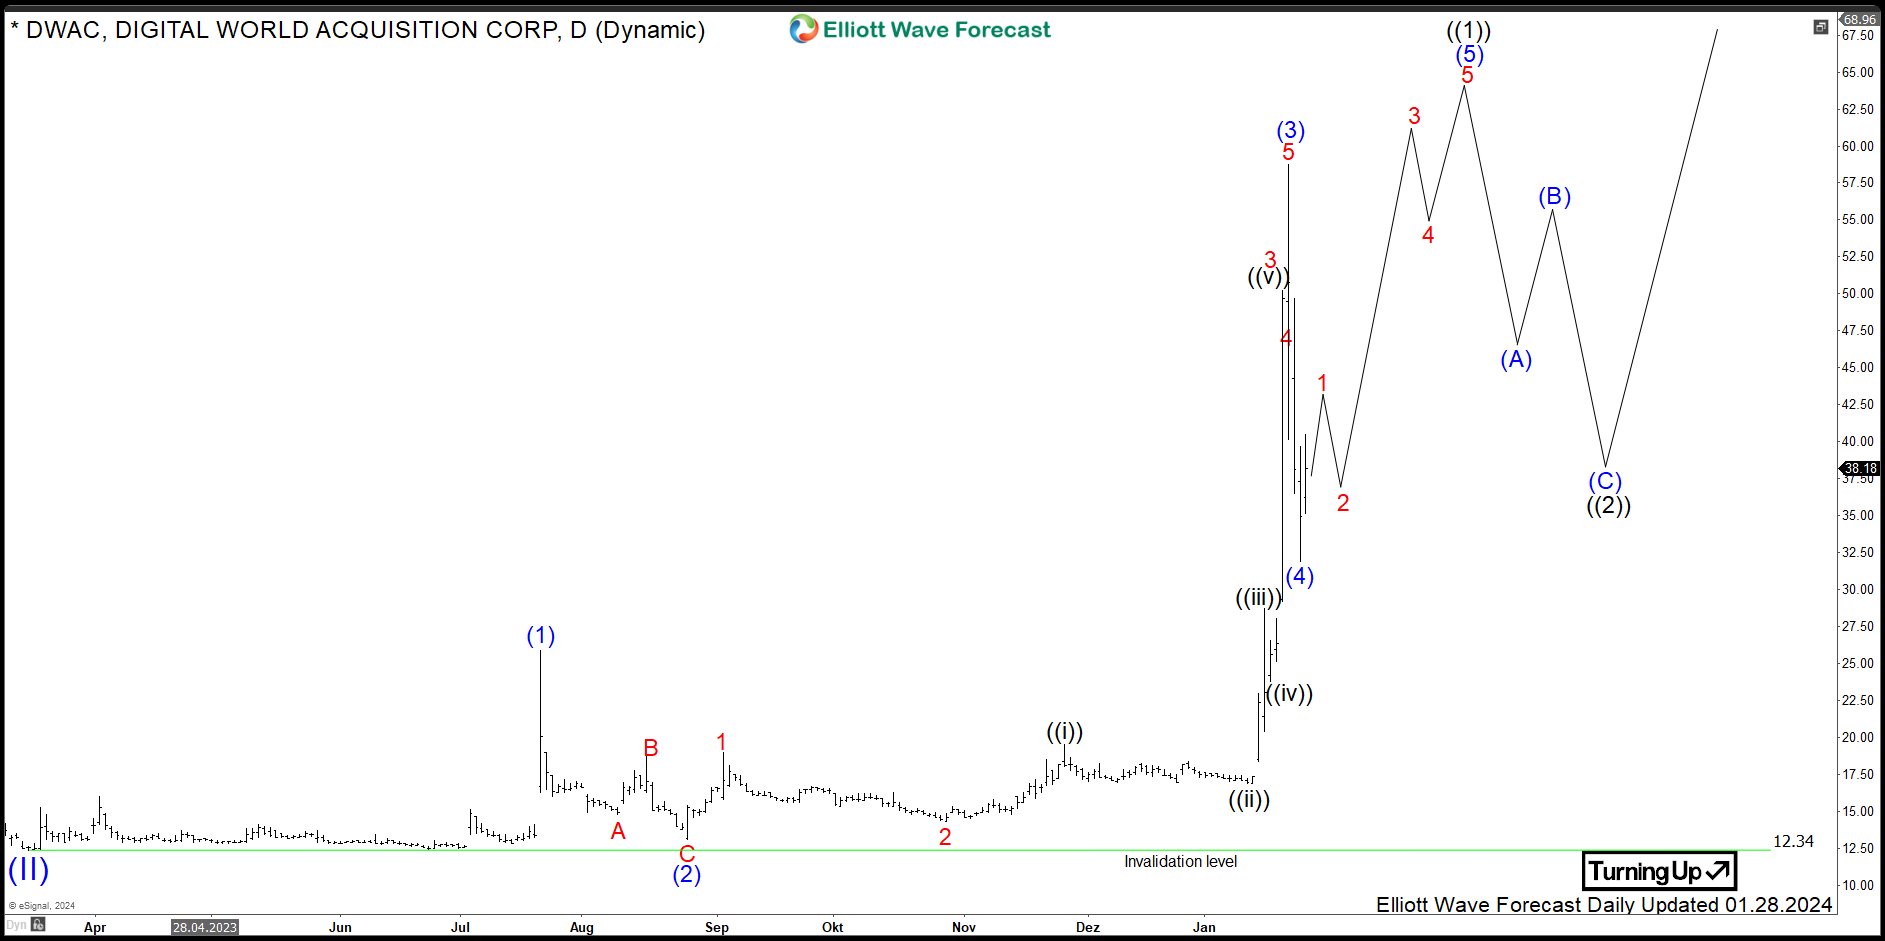
The daily chart below shows in more detail the initial stages of the blue wave (III). From the March 2023 lows, a bullish cycle in black wave ((1)) is unfolding as an impulse. Hereby, blue wave (3) shows an extension beyond 2.618x of the wave (1). Firstly, blue wave (1) has ended in July 2023 at $25.85 highs. Secondly, correction in blue wave (2) has set a bottom in August 2023 at $13.11 lows. Thirdly, extension in blue wave (3) has made a new high in January 2024 at $58.72. Fourthly, pullback in blue wave (4) has provided with a higher low in the same month. Now, while above $31.92, blue wave (5) is in progress. The target will be 65.05-75.30 area and even higher. Then, wave ((1)) should end and a pullback in black wave ((2)) should take place.
While investors can buy at market price, traders should be waiting for black wave ((1)) to end first. Then, pullback in black wave ((2)) is an opportunity to join the rally. Traders can be looking to buy wave ((2)) in 3, 7 swings against March 2023 lows for an acceleration higher in black wave ((3)) of red wave I.
Source: https://elliottwave-forecast.com/video-blog/digital-world-turning-higher/