McDonald’s (MCD) is the world’s largest fast food restaurant chain, serving over 69 million customers daily in over 100 countries in more than 40,000 outlets as of 2021. It is best known for its hamburgers, cheeseburgers and french fries, although their menu also includes other items like chicken, fish, fruit, and salads.
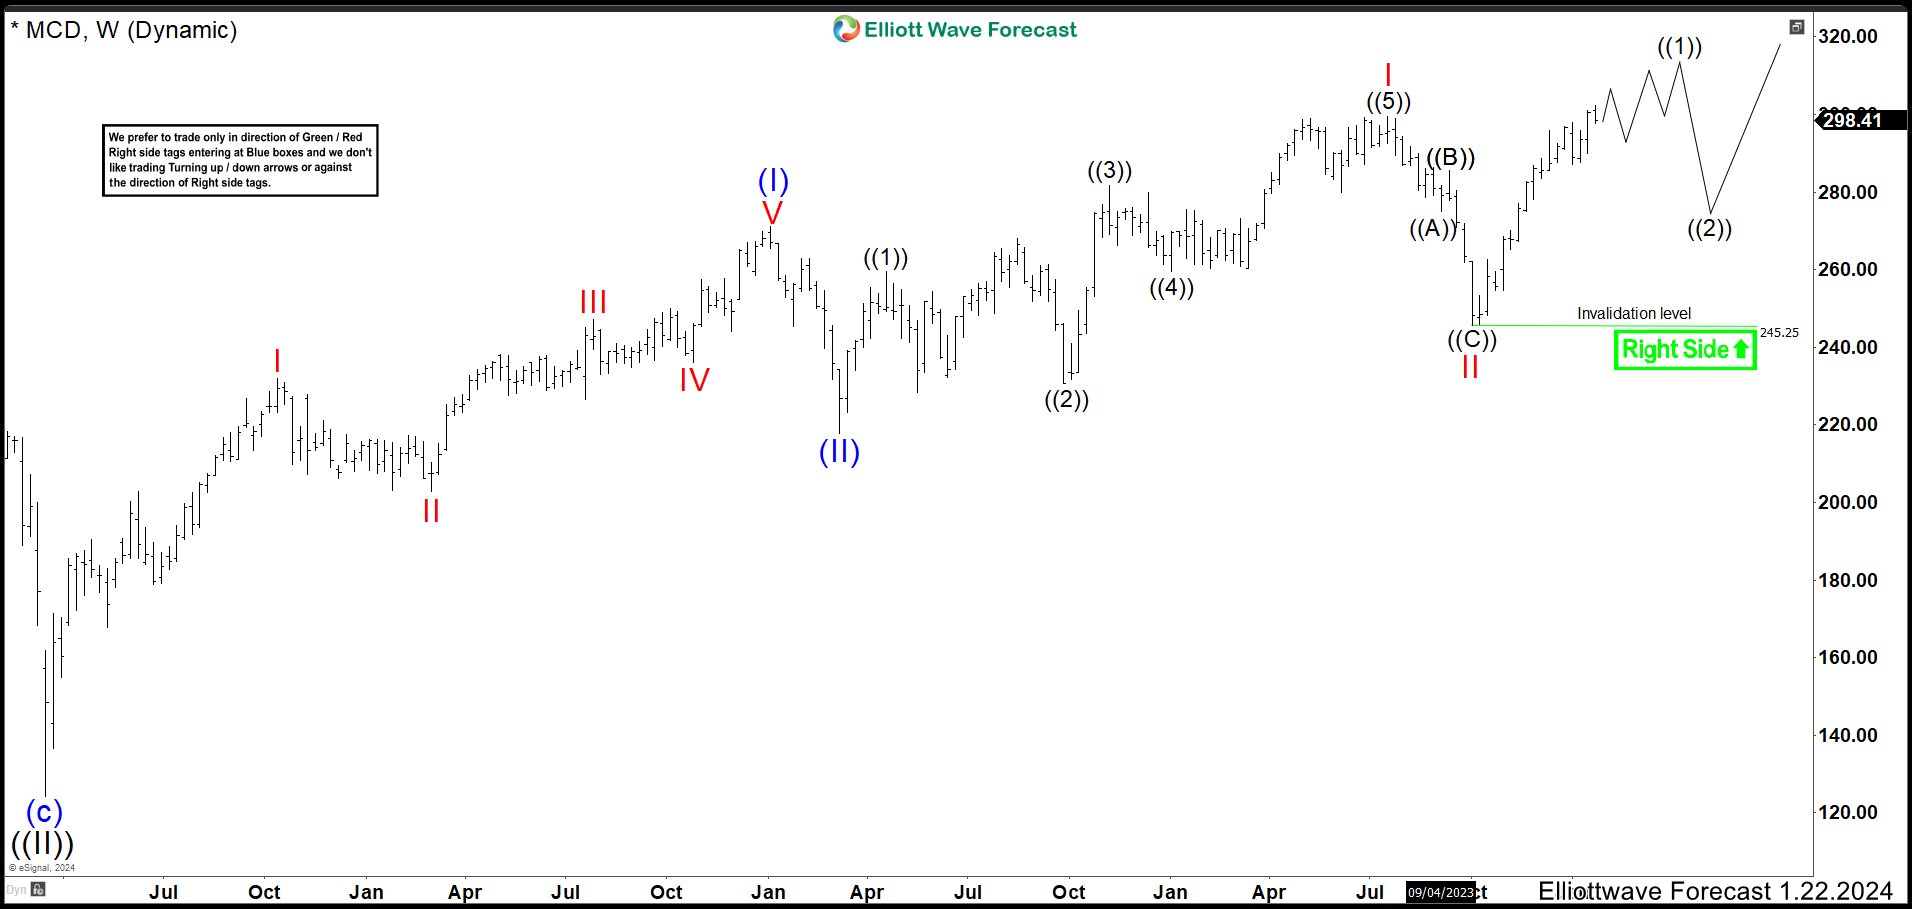
McDonald’s MCD Weekly Chart September 2023
Last September we were looking for buying opportunities on MCD. The stock continued lower as expected doing a zig zag correction as wave II. Market dropped to around 1.618 Fibonacci extension and it ended the corrective wave II at 245.73 low. The current rally has already broken the last high of 299.35 making a new all time high this 2024.
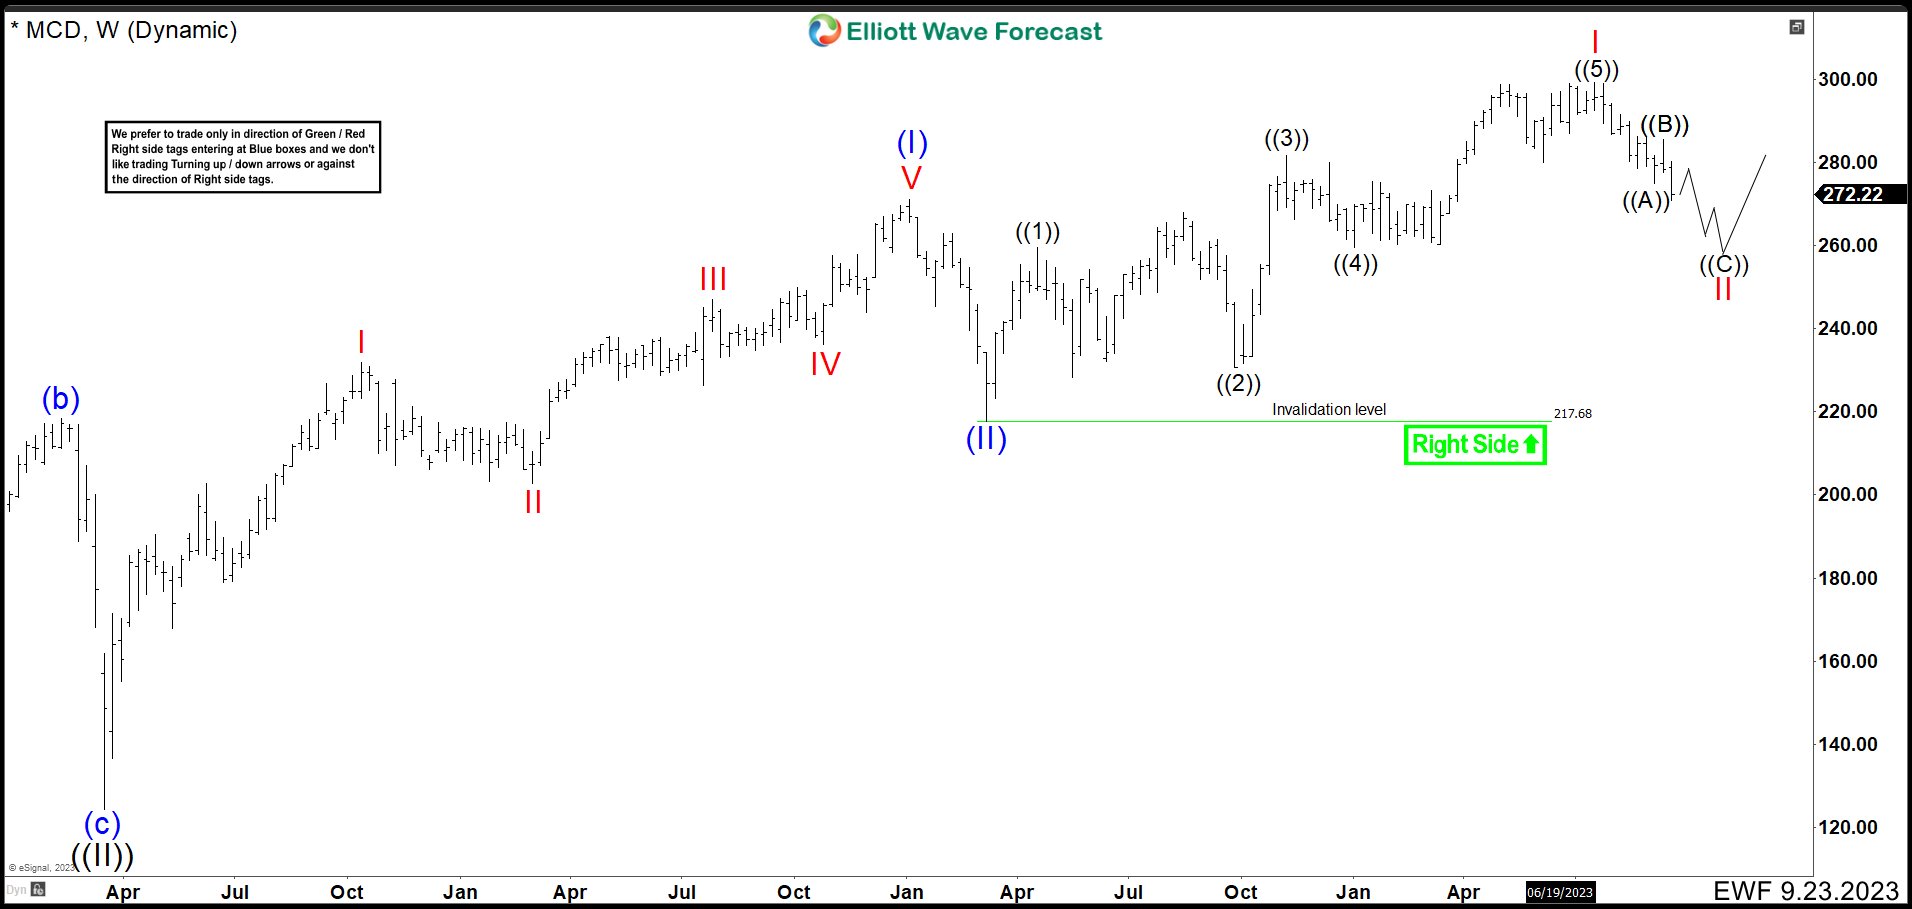
McDonald’s MCD Weekly Chart January 2023
Down from wave I, wave ((A)) ended at $275.00 and bounce as Wave ((B)) was rejected lower at $285.60 in wave ((C)). This wave ((C)) built an impulse structure that we looked to end in $260.99 – $245.82 zone, but it rallied slighly below from 245.73. Then wave II finished and MCD took a bullish momentum breaking $300.00. Actually, the stock should continue higher until it ends a new impulse as we called as wave ((1)). Once this structure has completed, the stock should pullback in 3, 7 or 11 swings and stays above 245.73 before resuming to the upside.
McDonald’s MCD Alternative Weekly Chart January 2023

An alternative view, you can check the chart above. MCD could be making a leading diagonal as wave (I) and all will depend of depth of the pullback. If the correction breaks below 245.73, then shares will enter in a big retracement that could end in the third quarter of the year.
Source: https://elliottwave-forecast.com/stock-market/mcd-slowdown-momentum-pullback/