
Home Depot (HD), is an American multinational home improvement retail corporation that sells tools, construction products, appliances, and services, including fuel and transportation rentals. Home Depot is the largest home improvement retailer in the United States.
After reaching all-time highs in December 2021, the price of HD fell considerably. According to the Elliott Wave Principle, the stock price should continue to fall after to end wave (b) pullback. Wave (b) entered in a double or a flat correction and we are going to talk about next.
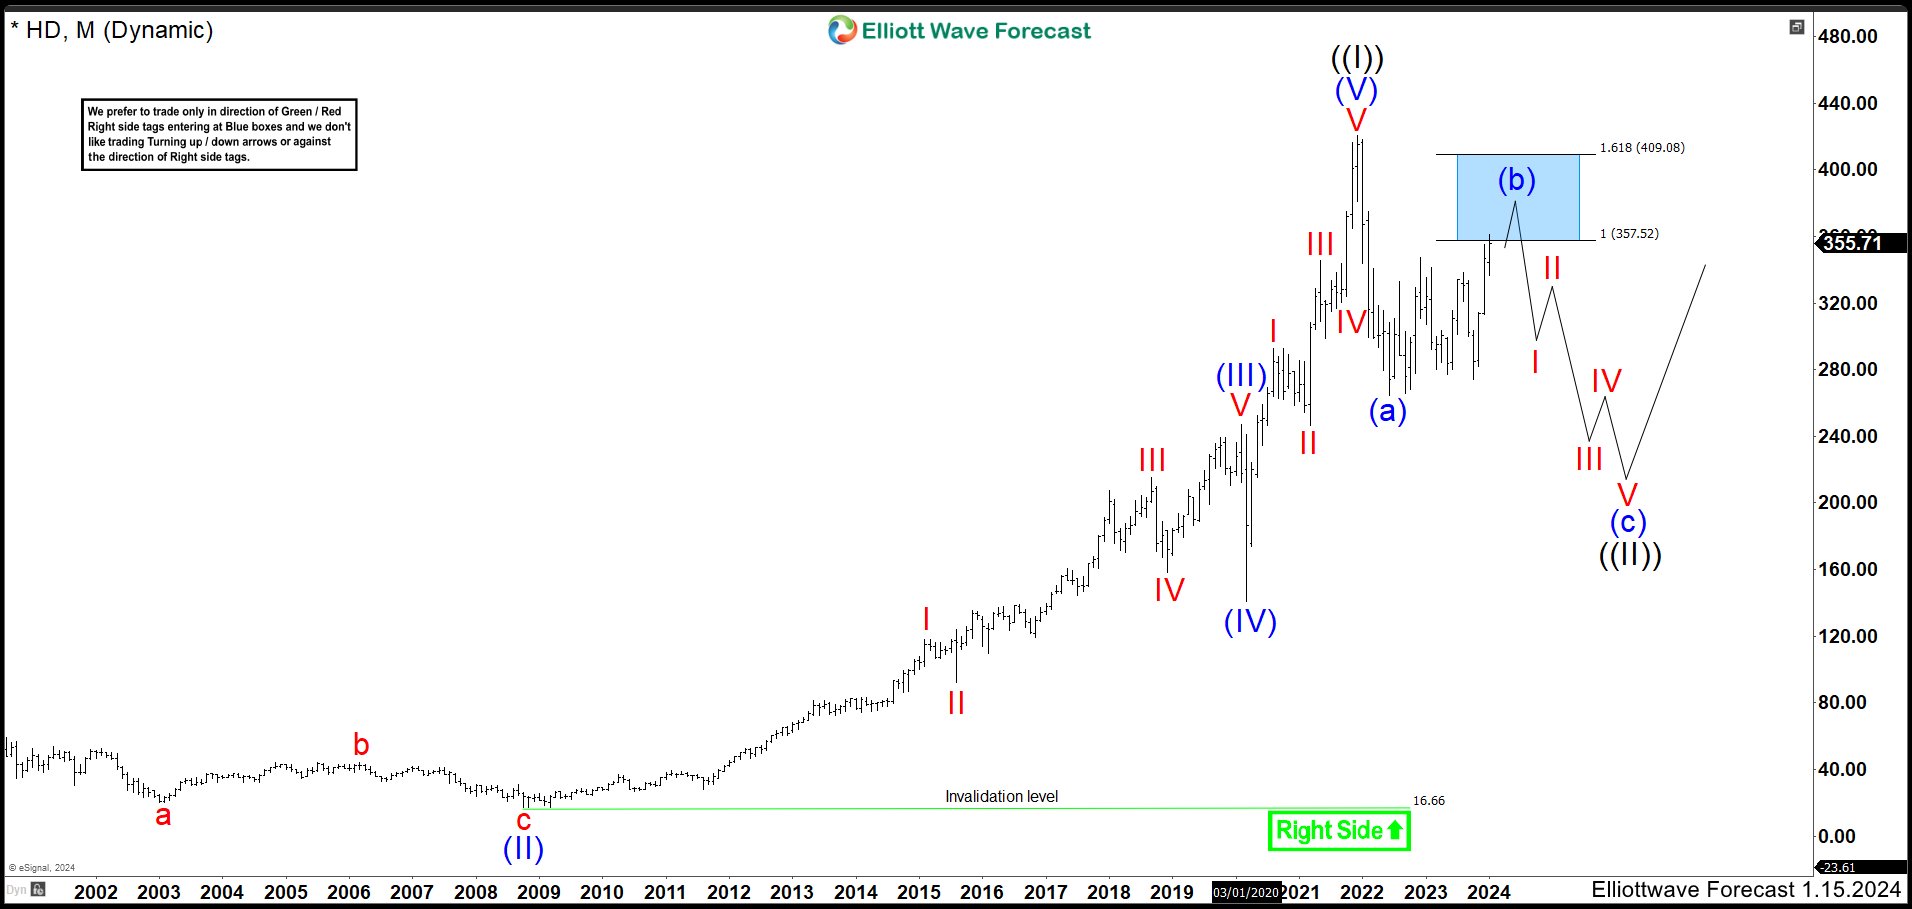
Home Depot HD Monthly Chart January 2024
Since December 2021 high, the price of HD has remained bearish and to complete a corrective structure it should continue with more decline. This is because, to finish a corrective structure is required a minimum of 3 waves where the third wave must break the end of the first wave at least marginally. Suggesting further drops in HD price in wave (c). Last time after 3 swings higher from wave (a) low, we called that wave (b) correction was completed. However, price action broke above 347.25, what we talked about last September as a possibility, making that HD enters in a incomplete bullish sequence. Wave (b) now, needs to end a new structure before resuming to the downside from 357.52 – 409.08 blue box area.
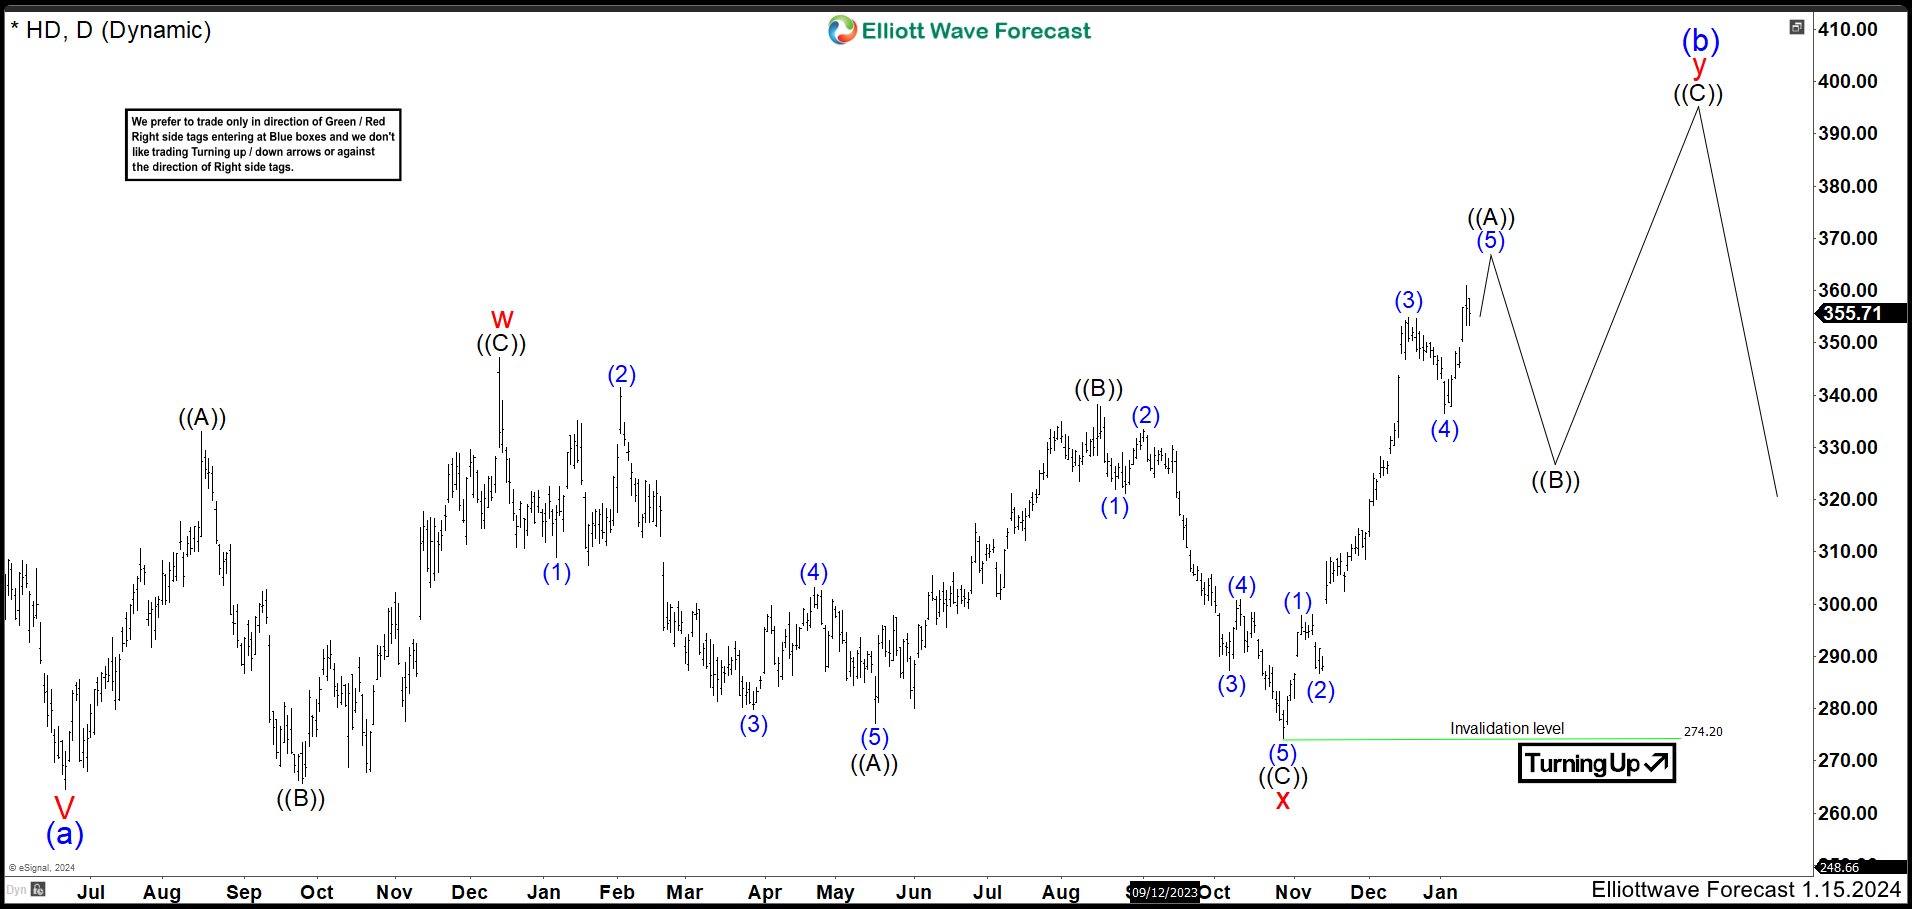
Home Depot HD Daily Chart January 2024
In Daily chart, we can watch closer what is happening with HD price. As 347.25 high was broken, the stock enters in a double correction structure. From wave (a) low, market made 3 swings higher ending wave “w” at 347.25 high. Then, we have 3 swings lower as a zig zag correction to end wave “x” at 274.20 low. As price action stays above 274.20 low, we expect to see 3 swings more to the upside to finish wave “y” of ((b)) before turning lower in wave (c).
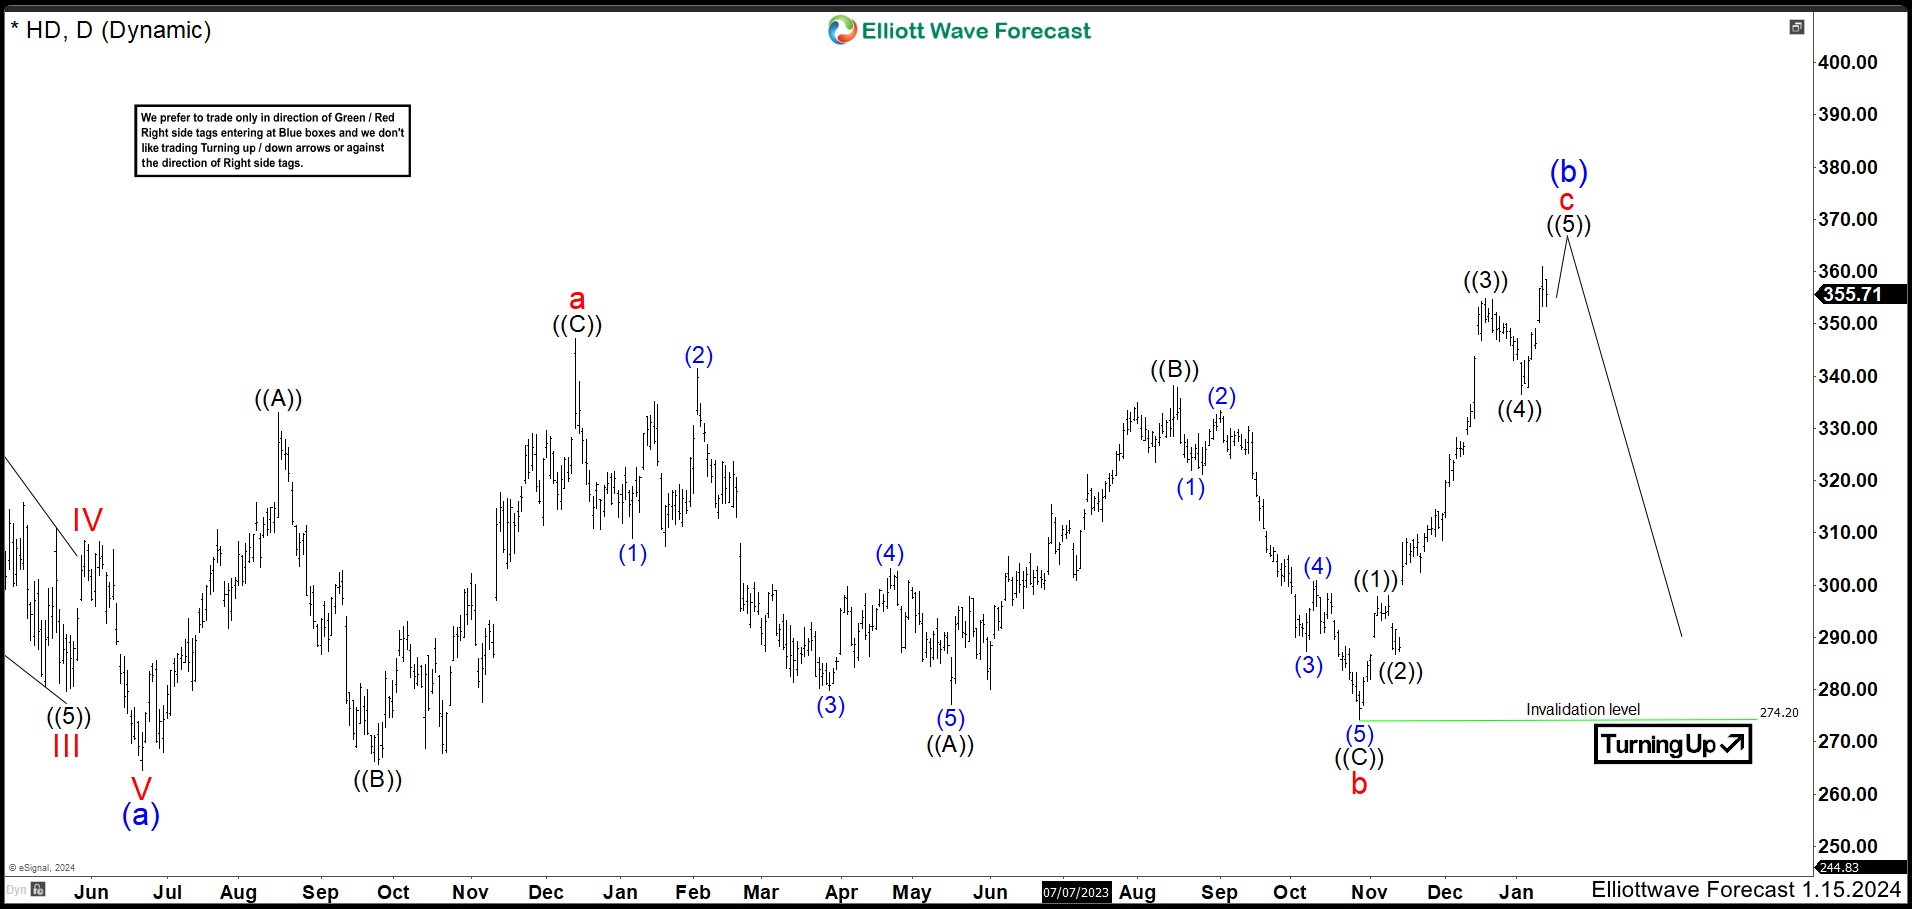
Home Depot HD Daily Chart Alternative January 2024
As alternative view, we are showing the chart above. This should happen if wave (b) is a flat correction 3-3-5. From wave (a) low, market made 3 swings higher ending wave “a” at 347.25 high. Then, we have 3 swings lower as a zig zag correction to end wave “b” at 274.20 low. Now, the stock should be near to end impulse as wave “c” and also (b) to continue to the downside in wave (c).
Checking both daily charts, we are expecting a movement lower and actually we do not know what form will take. If the pullback makes 3 or 7 swings lower, it is more likely that wave (b) will make double correction higher. If the drop shows an impulse lower then the probability that wave (c) lower has started is high.
Source: https://elliottwave-forecast.com/stock-market/hd-home-depot-selling-opportunities/