
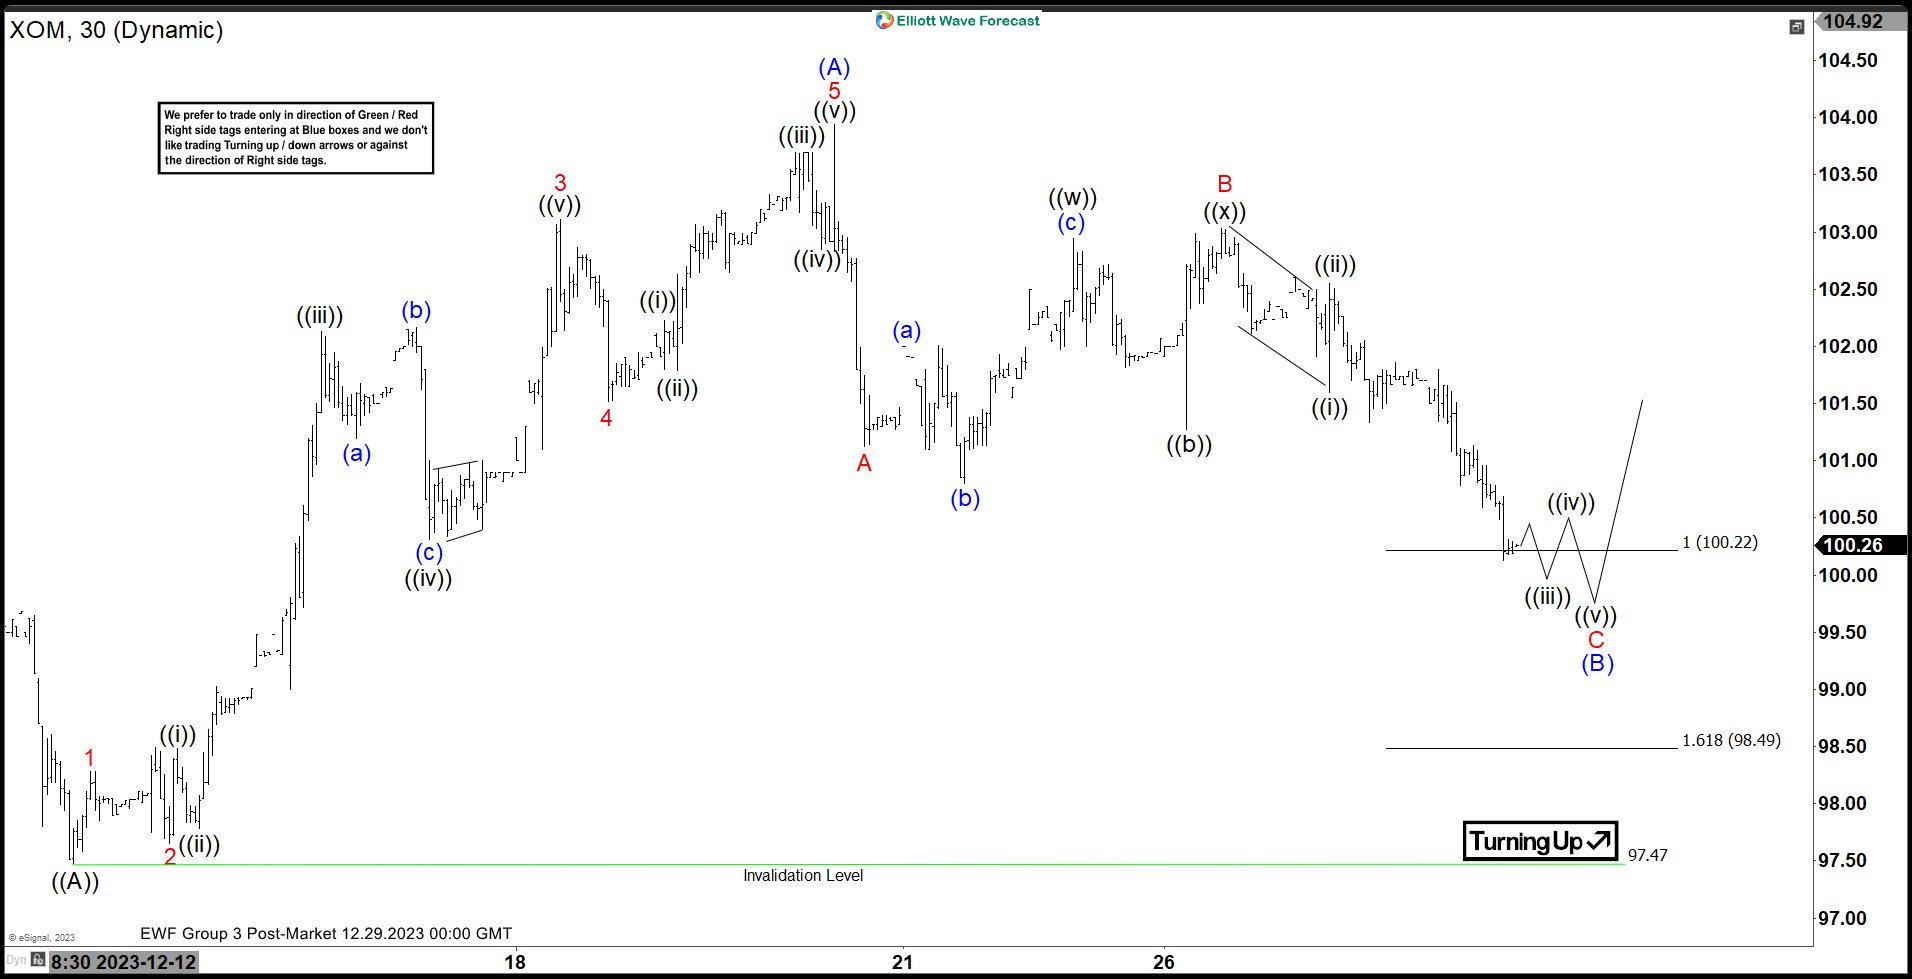
Hello everyone. In today’s article, we will look at the past performance of the 1H Hour Elliott Wave chart of Exxon Mobil Corp ($XOM). The rally from 12.12.2023 low at $97.47 unfolded as 5 waves impulse. So, we expected the pullback, once that cycle ended, to unfold in 3 swings and find buyers again. We will explain the structure & forecast below:
$XOM 1H Elliott Wave Chart 12.29.2023:
Here is the 1H Elliott Wave count from 12.12.2023. We expected the pullback to find buyers at Blue (B) in a 3 swing structure (ABC) at 100.22 – 98.49.
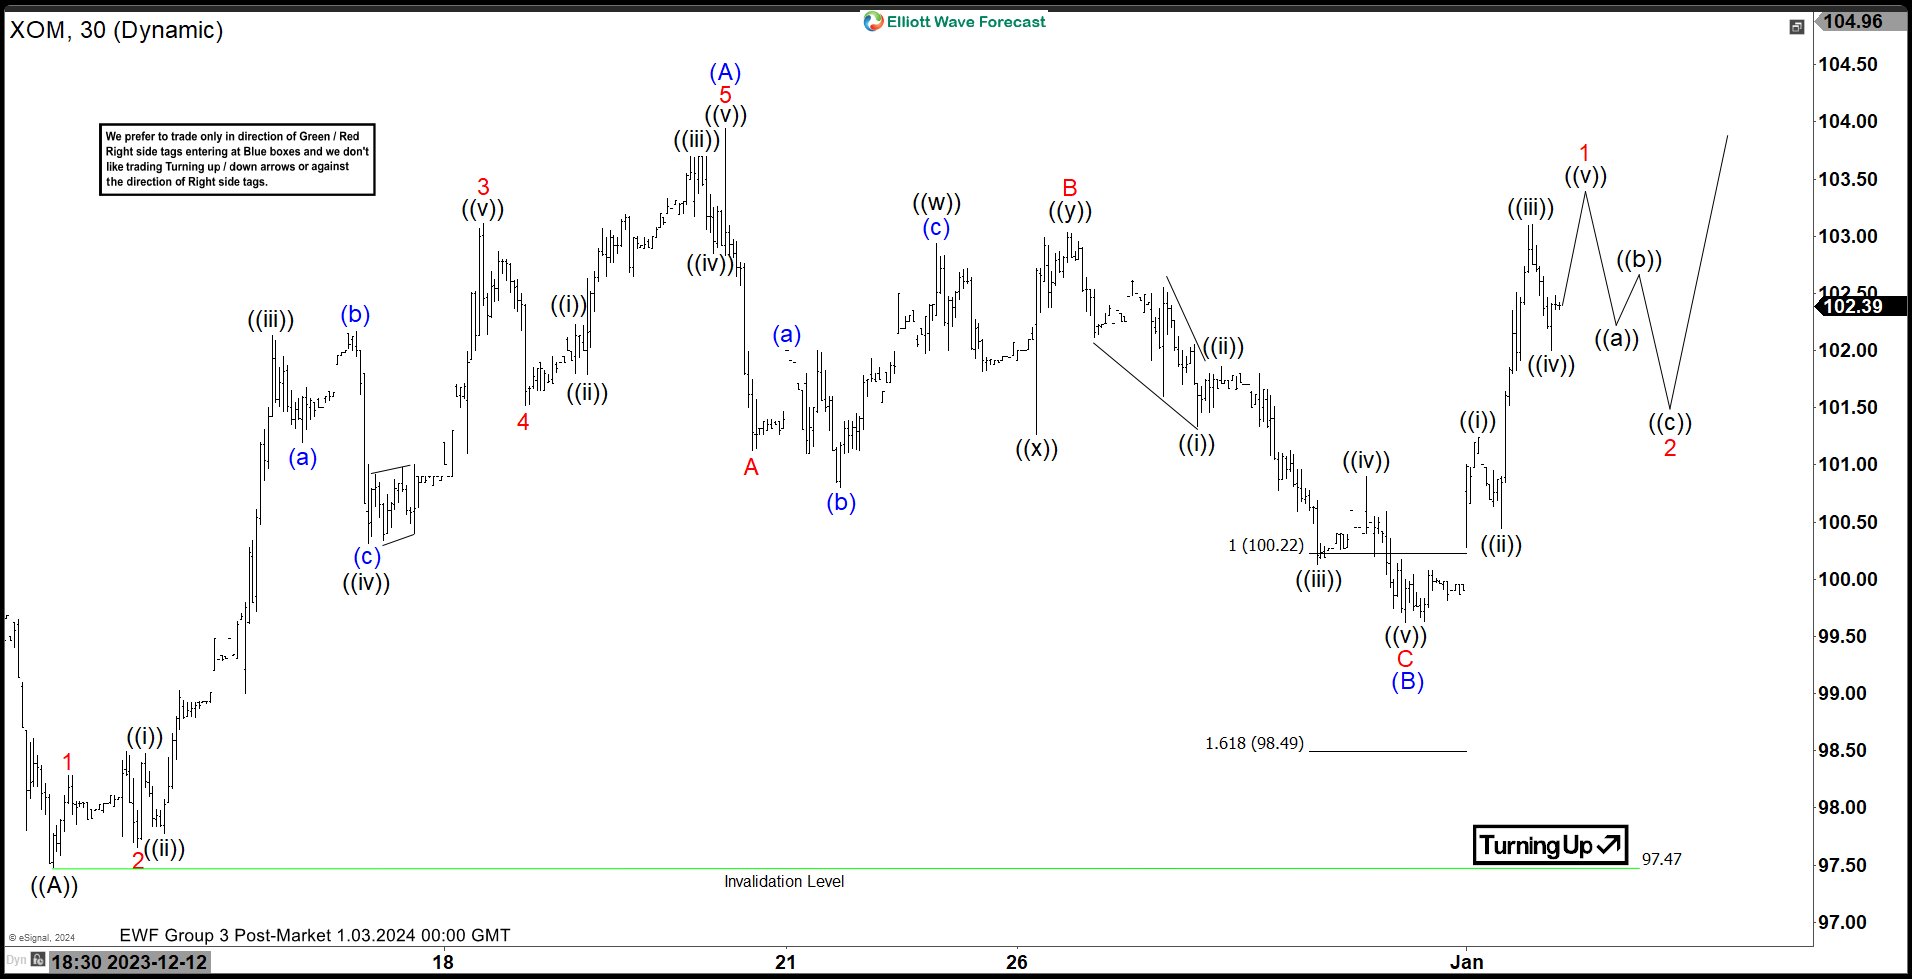
$XOM 1H Elliott Wave Chart 1.03.2024:
Here is the 1H update from 1.03.2024 showing the bounce taking place as expected. The stock reacted higher after reaching the extreme area allowing longs to get into a risk free position.
Source: https://elliottwave-forecast.com/video-blog/exxon-mobil-corp-xom-found-buyers-extreme-area/