
Hello fellow traders. In this technical article we’re going to take a look at the Elliott Wave charts charts of Dow Futures ($YM_F ) published in members area of the website. As our members know YM_F we see cycle from the 32406 low completed at the 38115 peak. While below that level, we could be getting a deeper correction. Recently, the futures reached the intraday equal legs from the 38115 peak and made 3 waves bounce as expected. In further text we’re going to explain the Elliott Wave pattern and forecast.
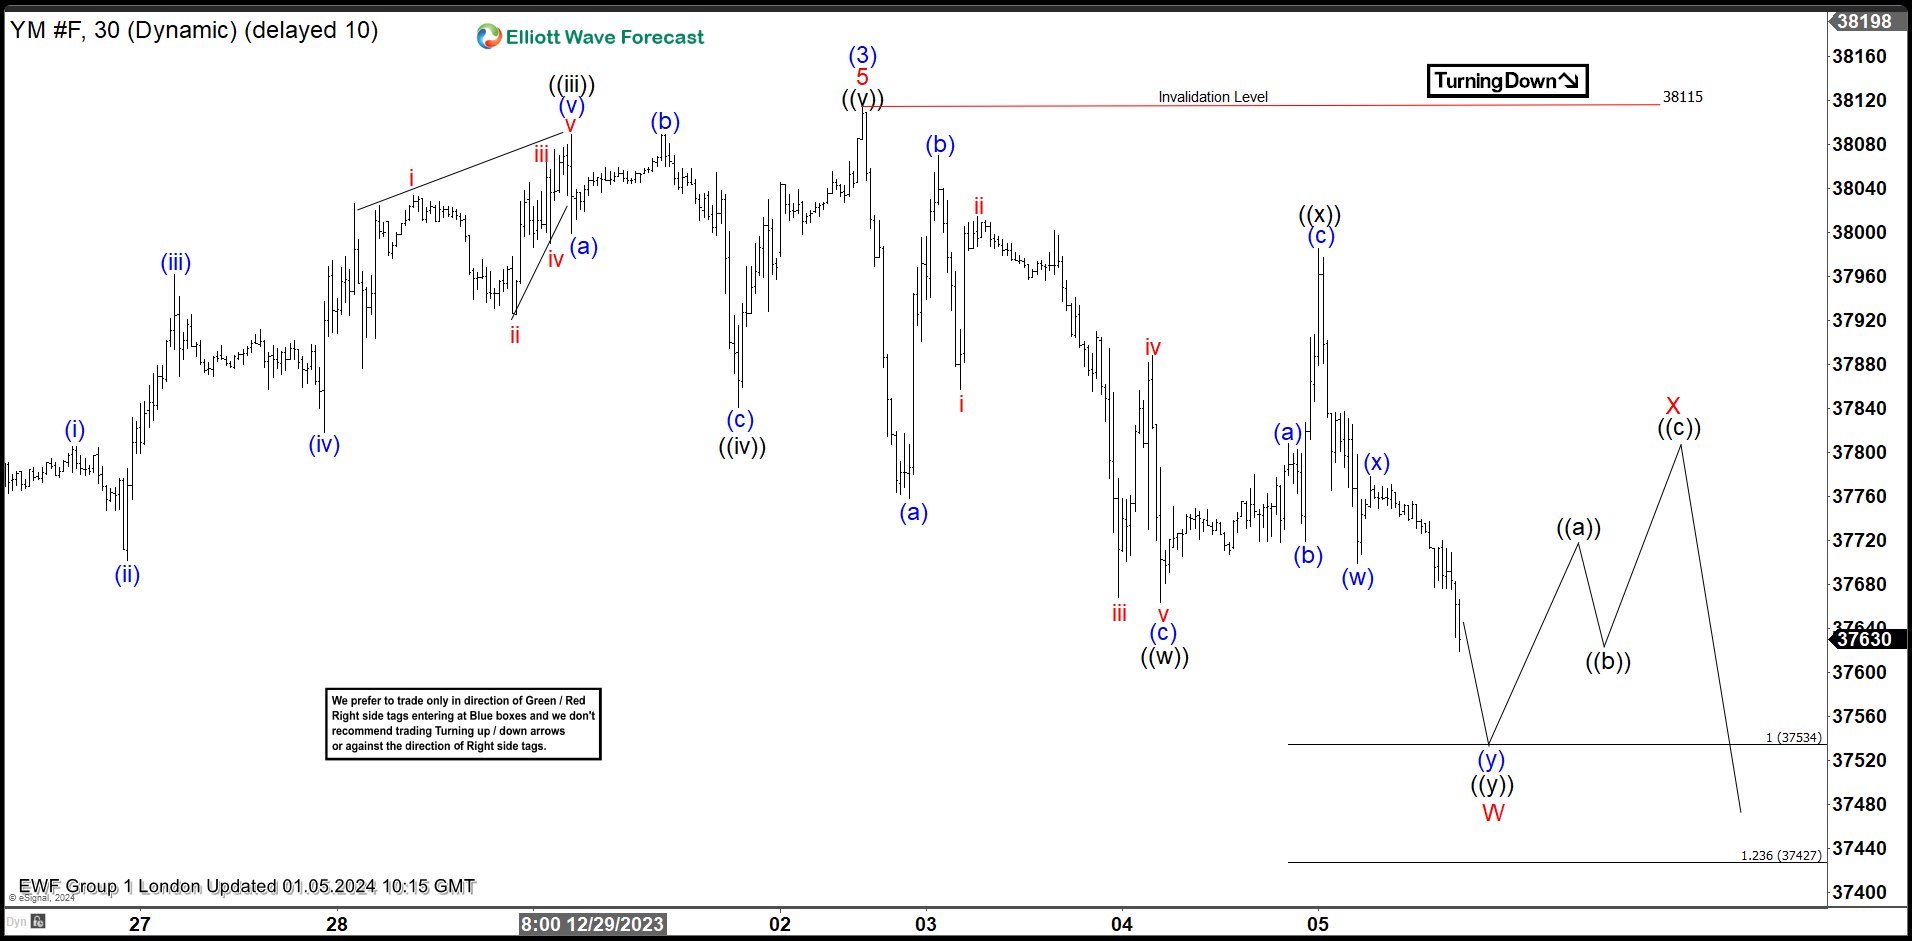
Dow YM_F Elliott Wave h1 Chart 01.05.2023
Cycle from the 38115 peak looks incomplete at the moment. The futures shows lower low sequences, suggesting more short term weakness toward 37534-37427 area. At the marked zone we can be ending first leg W red as potential Double Three pattern. From that zone we expect to see 3 waves bounce before more weakness is seen in Y red leg.
You can learn more about Elliott Wave Double Three Patterns at our Free Elliott Wave Educational Web Page.
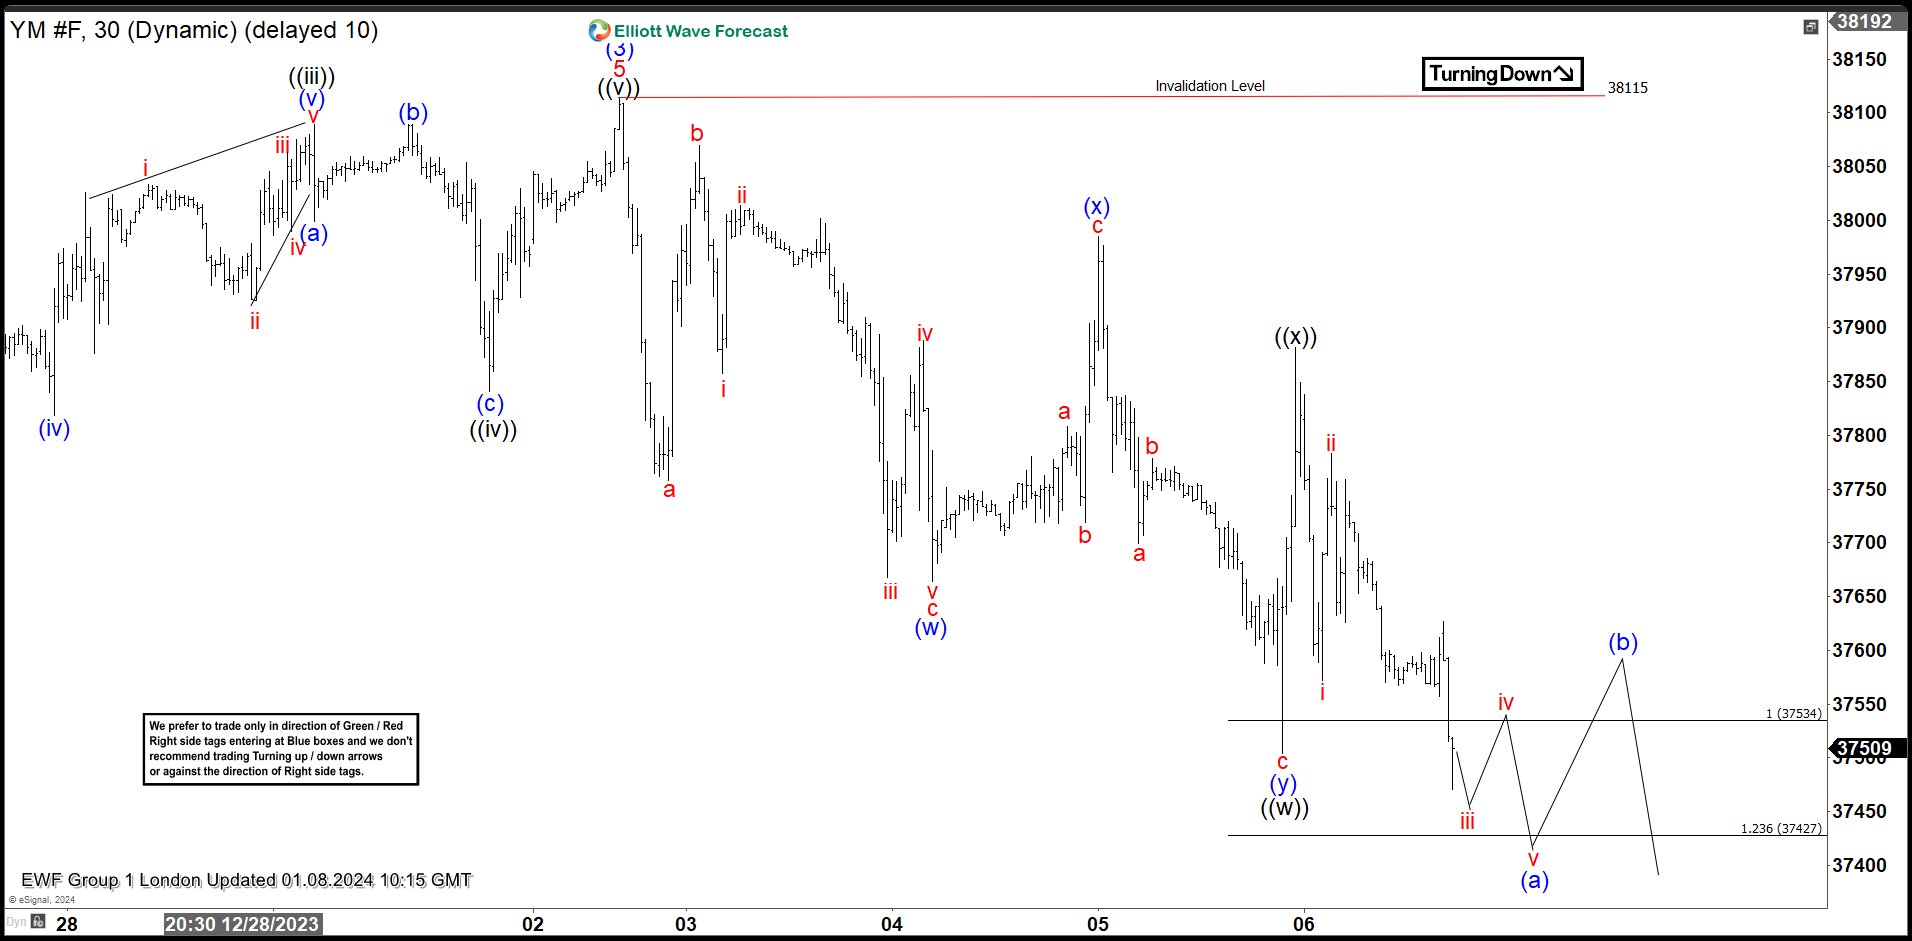
Dow YM_F Elliott Wave h1 Chart 01.08.2023
Dow Futures made decline and the price reached extreme zone from the peak at 37534-37427 . We got nice bounce against the 38115 peak, after which the price turned lower again and made break toward new lows as expected. At the moment the price structure from the 38115 peak is incomplete again, suggesting more weakness ideally in near term. Next tech zone to the downside comes at 37287 area.
Keep in mind not every chart is trading recommendation. You can check most recent charts and new trading setups in the membership area of the site. Best instruments to trade are those having incomplete bullish or bearish swings sequences. We put them in Sequence Report and best among them are shown in the Live Trading Room.
Source: https://elliottwave-forecast.com/stock-market/dow-futures-ym_f-elliott-wave/