
AT&T Inc. (T) is an American multinational telecommunications holding company headquartered in Dallas, Texas. It is the world’s largest telecommunications company by revenue and the third-largest provider of mobile telephone services in the U.S.
T Weekly Chart Septembre 2023
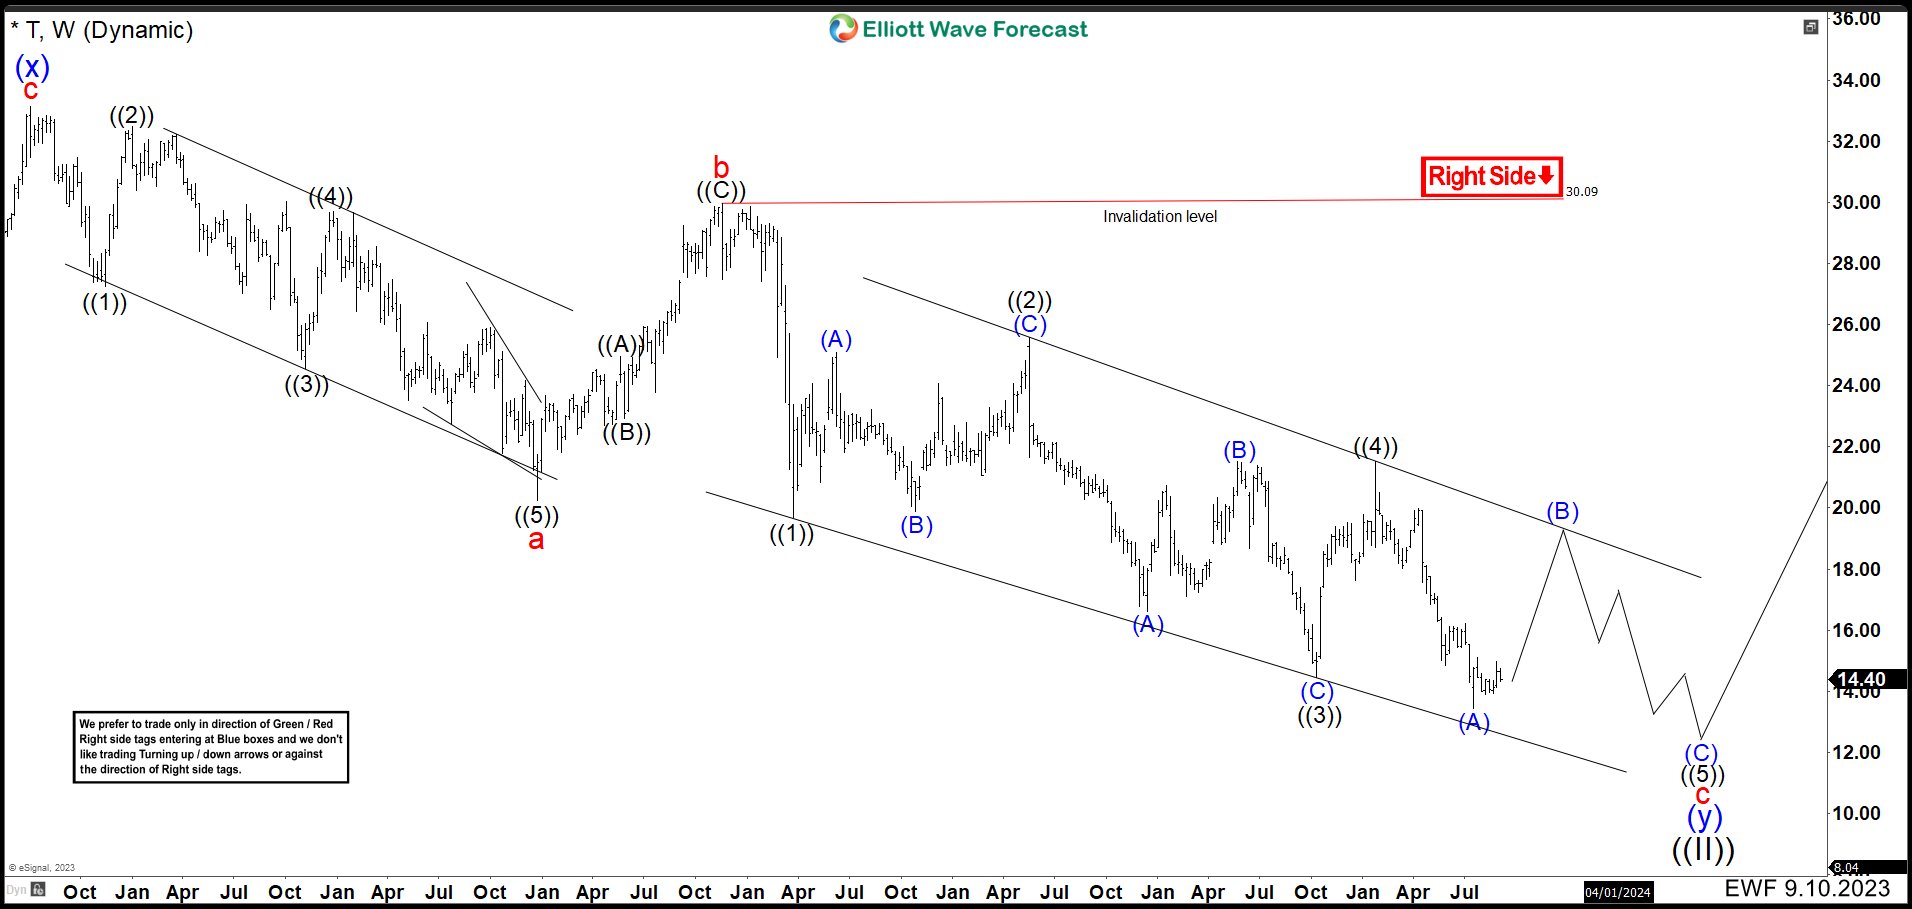
On the weekly chart of T, we saw in more details the structure of the wave (y). Wave a in red made a leading diagonal that ended at $20.21. Then it bounced in 3 waves ending wave b at $29.96 to continue sharply lower. Wave c took the form of an ending diagonal. Down from wave b in lesser degree, wave ((1)) ended at $19.60 low. Wave ((2)) made 3 swings up to complete at $25.57 high. Another 3 swings lower ended at $14.46 as wave ((3)) and strong rally made wave ((4)). The rally entered in wave ((1)) zone giving the ending diagonal Elliott structure, completing wave ((4)) at $21.53 high.
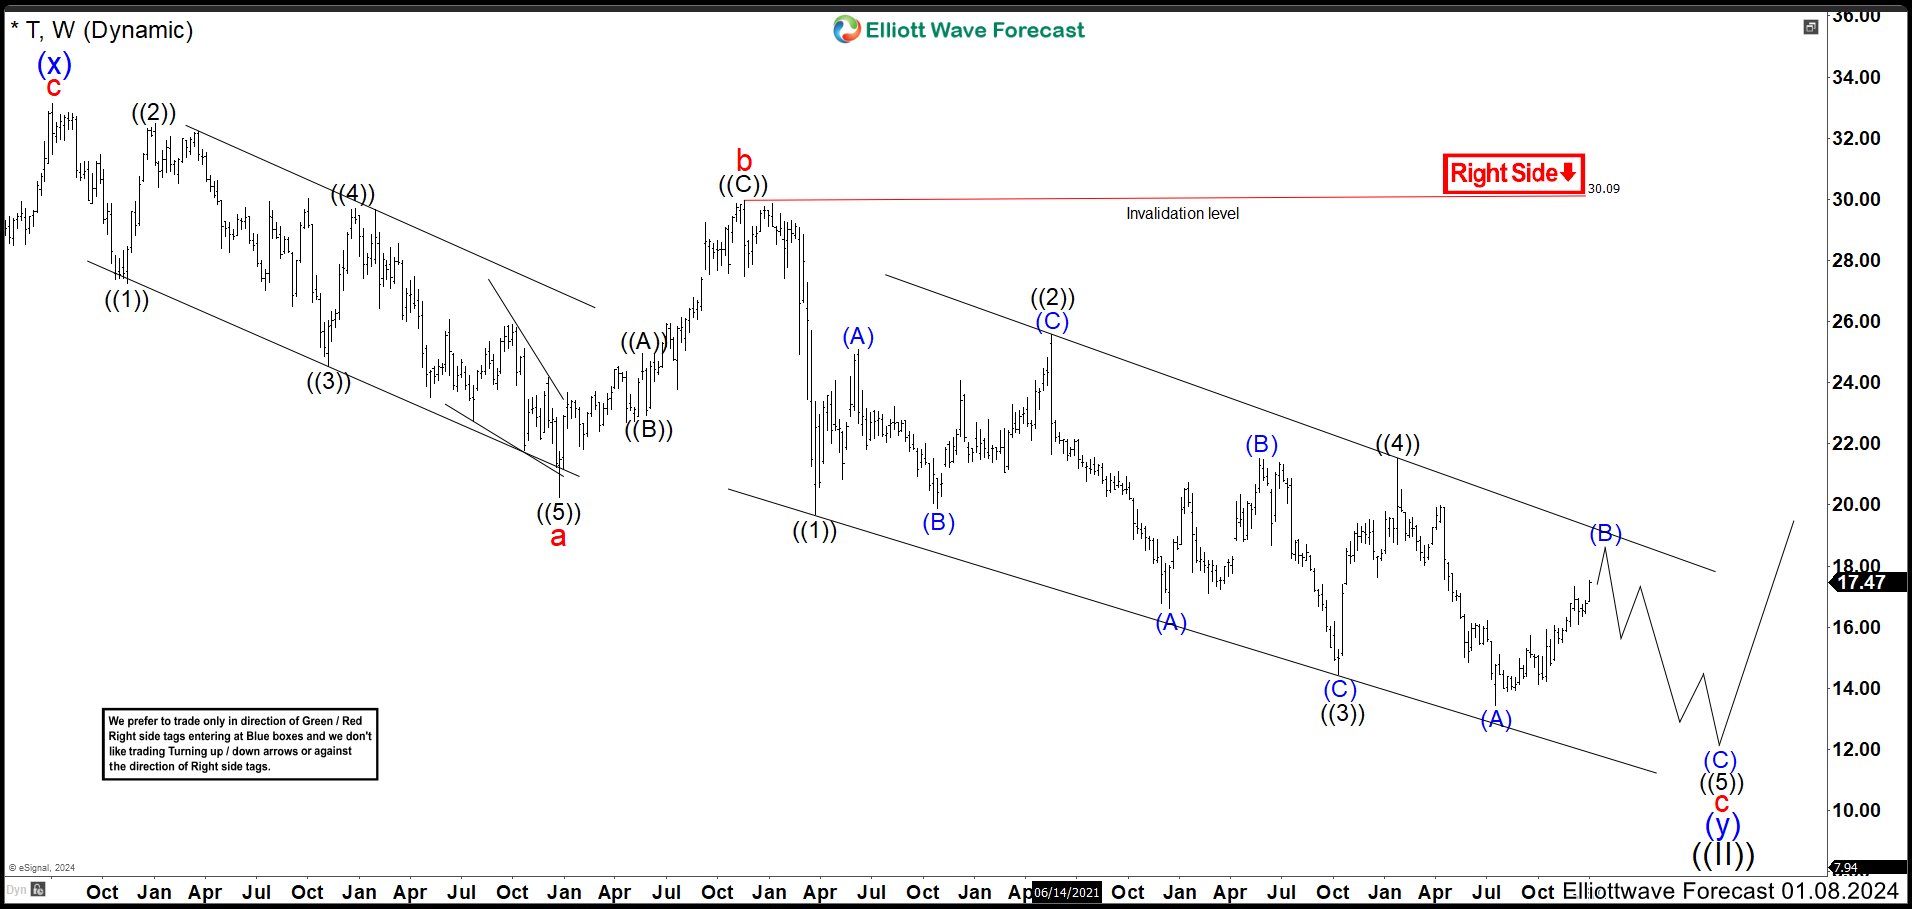
T Weekly Chart January 2024
On January weekly chart, we can see the structure needs 3 waves lower to end wave ((5)). Wave (A) of ((5)) has ended at $13.43 and wave (B) started. Therefore, we expect to see a bounce higher in 3, 7 or 11 swings without breaking $21.53 wave ((4)) high to complete wave (B) before resuming lower in wave (C). Wave (B) still remains bullish to end the corrective structure. It could end in 17.82 – 19.00 area. To confirm the view, the stock have to break $13.43 low. In that case, we can calculate the possible area where wave ((5)) could end and also the whole correction of wave ((II)) to look for buying opportunities.
Source: https://elliottwave-forecast.com/stock-market/t-expected-complete-bearish-sequence/